
Gold Hourly Chart

Gold hourly charts taken from MT4 platform try to break its downward falling channel but failed to do so as shown in above chart. Gold is heading towards its intermediate swing bottom of 1272. Resistance on upside comes to $1343. Fall was not backed by huge volumes so expect pullback in todays session.
Gold Daily
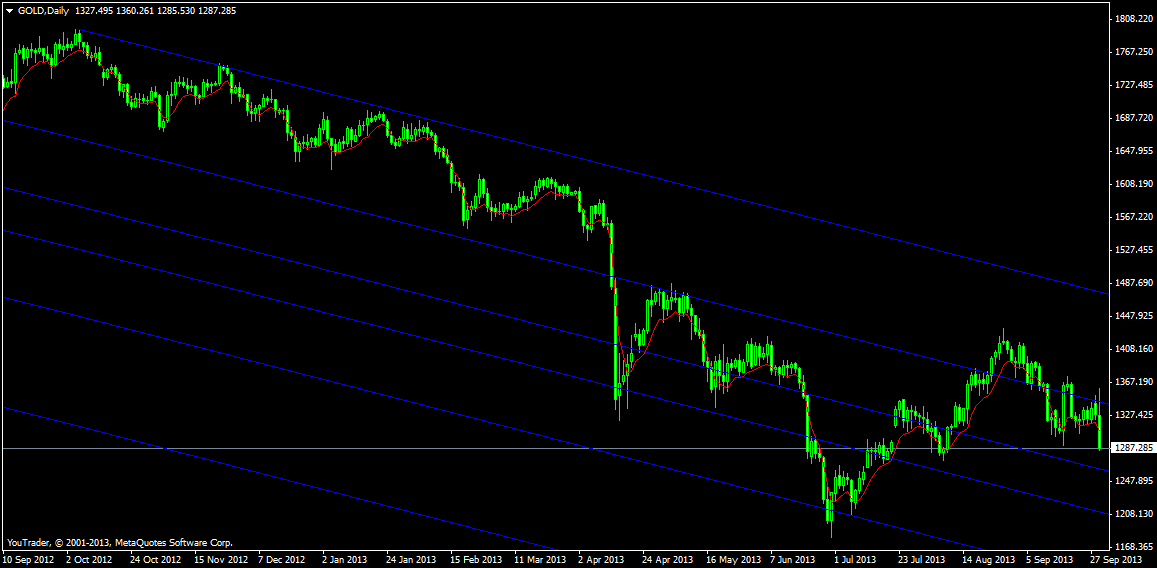
Gold daily MT4 platform charts are stuck in fibo channel of 1248-1327. Except volatile moves in this range for some time before a decisive move ahead.
Gold Weekly
 Gold
weekly chart hasve taken support at its 50% retracement as shown in
abvoe MT4 Gold weekly chart.ON Weekly time frame gold is stuck between
its 50% and 38.2% retracement.Weekly RSI is also taking support at its
trendline.
Gold
weekly chart hasve taken support at its 50% retracement as shown in
abvoe MT4 Gold weekly chart.ON Weekly time frame gold is stuck between
its 50% and 38.2% retracement.Weekly RSI is also taking support at its
trendline.So best strategy for gold is buy in range of 1270-1280 and Sell in range for 1340-1350.
No comments:
Post a Comment
Note: Only a member of this blog may post a comment.