Sunday, October 19

How will Nifty react to economic and political news flow ?

Last week we gave  Nifty Chopad level of 7883 and Nifty did 2 target of downside rewarding chopad followers by 151 points. Nifty witnessed a volatile week due to wild swings seen in global markets. Tomorrow market will open reacting to both political and economic news. Diesel deregulated, natural gas price hiked and BJP set to form government in both Maharashtra and Haryana and taking Modiji dream of "Congress Mukt Bharat" one step closer. Lets see how to trade market next week. 24 October  is again a trading holiday.

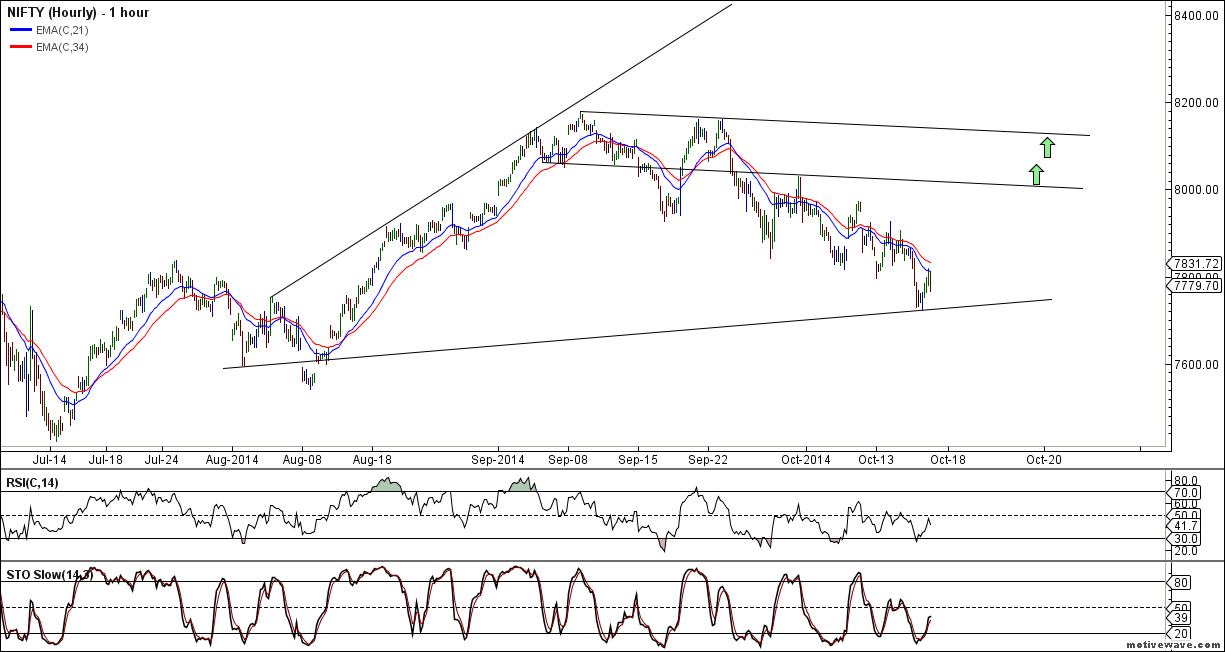
 Nifty Hourly Chart

nifty hourly


Nifty Hourly charts 21/34 EMA have gone flat, trendline support exists @ 7723/30  range, Bulls will get active above ..
Continue Reading

Saturday, October 18

Trading with Clouds

As if investing was not complicated enough, any mention of ‘technical analysis’ is likely to cause most individual investors to roll their eyes and ask “What now?” Fear not. You’re set to learn one of the easiest and yet most powerful approaches to market analysis that may help improve your investing and maybe even give you peace of mind.
Technical Analysis (TA), for those unfamiliar with the term, is an approach to market analysis that focuses on price movements. Well-intentioned people can reasonably debate about what the proper value of a share of Google or Coca Cola should be, or what the right value of gold is.
One issue they can’t dispute is what the price of Google, Coke, or gold is now or what it’s been in the past. That’s where technical analysis comes in. Technical Analysis takes the subjectivity (and emotion) out of the picture and zeroes in on the one component of an investment that we can all see: the price.
There are literally hundreds of different approaches to technical analysis, with thousands of books and articles having been written about them. The approach we introduce below is known as Ichimoku, a form of a moving average system. Ichimoku (ee-Chee-Mo-koo) charts offer a powerful tool for investors to identify overall market trends and pinpoint key levels of support and resistance that are unlikely to be revealed by other forms of technical analysis.
Don’t be scared off by the name—that’s where the simplicity comes in. Developed...

Continue Reading

Wednesday, October 15

Nifty medium term view using Gann

Nifty has been in correction mode ever since it hit the High of 8180 on 08 Sep 2014, It has been in sideways choppy mode from that point of time.As discussed in our Facebook page we are seeing some big move coming in Nifty.
Using Gann 52 concept , classic technical Analysis I am putting forward the view till end of 2014, use the below view as an input to your trading/investing plan, Do not blindly follow the same.

1. Trendline Support

Trendline

AS seen in above chart, Nifty is holding on to its trendline support and also 61.8% retracemetn @ 7784, low made was 7796 which signify bulls are still in control over market

2. Hammer Candlestick


Continue Reading

Tuesday, October 14

Arvind,Biocon and JSW Steel Harmonic pattern analysis

Arvind

Arvind
Positional traders should watch for  Any close above 288 stock is heading to 300/322.

Intraday traders can use the below levels

Buy above 284 Tgt

Continue Reading

FII FnO Data Analysis for 14 Oct

FII_1
Drive Wealth
  • FII's sold 20.9 K contract of Index Future worth 822 cores, 12.3 K Long contract were squared off  and 8.6 K short contracts  were added by FII's. Net Open Interest decreased  by 3.6 K contract , so FII liquidated long in index futures  and added  short in index futures.
Nifty dipped below the 50% gann box line, but recovered immediately and closed near the important resistance zone of 7904-7924 range. On Downside 7860/7850 range will act as strong support. Nifty still has not closed above its 50 DMA so bears have upperhand in short term. Inflation data and Reliance results both were favorable suggesting bulls will have upperhand

Continue Reading