Nifty Technicals for Week starting 21 March
Nifty Hourly Chart
 Nifty Hourly chart is moving in a channel forming Lower Highs and Lower lows as seen in the chart.
Stochastic is in Oversold zone which indicates we can have a bounce for time being which should be sold.
Indicators can remain overbought and oversold for an extended period of time.
Support of Trendline comes @5320 which should hold for market to bounce.
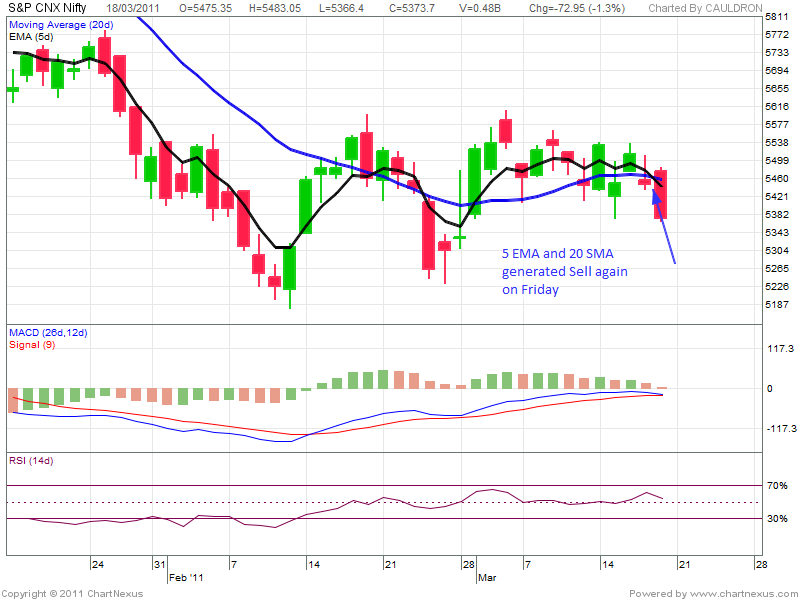
Nifty Daily

Nifty Positional trading system has generated a SELL once again last friday with a crossover of 5 EMA with 20 SMA on daily charts.
Positional Shorts takes @5455 should be held now with a trailing sl of Crossover of 20 SMA on closing basis.
 Importance of 5320-5340 is also indicated in above Daily Chart of Nifty as it can be seen as a formation of Lower high if its held next week.
But following observation needs to be noted down:
 On Weekly chart 5 EMA low@5361 is last hope for BULLS if it gets broken more Blood will be there on streets.
Weekly Pivot:5472
Nifty OI Chart (http://bramesh-niftyoi.blogspot.com/)
 As per Options Open Intrest Picture 5500 CE is having Highest OI @9,497,700 and 5300 PE is having Higest OI@8,290,700 with OI addition.
Nifty monthly low @5366 made on last friday and Range for March month is expanding.
Looking for Global news
1. China increasing reserve ratio to 50 BPS will have negative impact.
2. Japan nuclear radiation and contamination of food and water also have negative impact.
3. Dow can end its bull run.
4. Intervention of West in Libya and Gafaddi breaking ceasefire.
5. Middel east crisis
6. Political uncertanity at HOME.

Stochastic is in Oversold zone which indicates we can have a bounce for time being which should be sold.
Indicators can remain overbought and oversold for an extended period of time.
Support of Trendline comes @5320 which should hold for market to bounce.
Nifty Daily
Nifty Positional trading system has generated a SELL once again last friday with a crossover of 5 EMA with 20 SMA on daily charts.
Positional Shorts takes @5455 should be held now with a trailing sl of Crossover of 20 SMA on closing basis.

But following observation needs to be noted down:
- MACD has triggered a SELL
- RSI is above 50 not in oversold zone.
- Nifty Closed below 5 Day LOW EMA@5413
- Whenever Nifty cloeses below 5 Day Low EMA more downside will emerge.

Weekly Pivot:5472
Weekly Support:5381 and 5317
Weekly Resistance:5536 and 5627Nifty OI Chart (http://bramesh-niftyoi.blogspot.com/)

Nifty monthly low @5366 made on last friday and Range for March month is expanding.
Looking for Global news
1. China increasing reserve ratio to 50 BPS will have negative impact.
2. Japan nuclear radiation and contamination of food and water also have negative impact.
3. Dow can end its bull run.
4. Intervention of West in Libya and Gafaddi breaking ceasefire.
5. Middel east crisis
6. Political uncertanity at HOME.
posted by Bramesh at
10:11 AM
![]()
![]()

0 Comments:
Post a Comment
Note: Only a member of this blog may post a comment.
Subscribe to Post Comments [Atom]
<< Home