SBIN

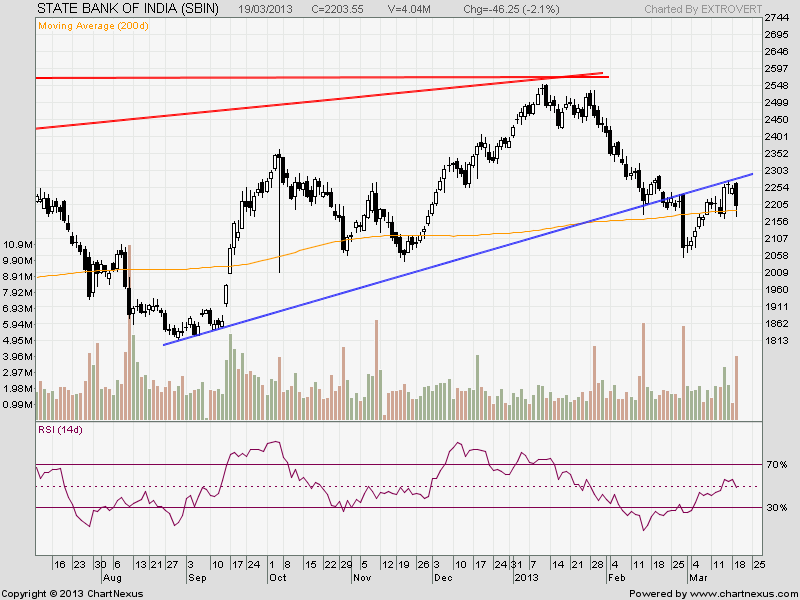
SBI has been following classical technical analysis
support becoming resistance, as
shown in above chart, rising trendline which was supporting the upmove
is now acting as resistance, stock is showing pullback as soon as it
approach the trendline. Stock is also near its 200 DMA @2188 and bounced
back sharply. Any close below 200 DMA on weekly basis will make the
long term trend in stock as bearish.
Buy above 2220 Tgt ..
Continue Reading

0 Comments:
Post a Comment
Note: Only a member of this blog may post a comment.
Subscribe to Post Comments [Atom]
<< Home