Gold Technical charts after worst Sell Off in 30 years
15 April is the largest one day decline from the previous day's close @ -9.6%. Volume is already north of 530,000
There have been three rounds of liquidations.
- Asian liquidation
- European liquidation
- US liquidation phase . You are witnessing an historical selling climax folks.
- Another trigger for selling is CME Hikes Gold, Silver Margins By 18.5%
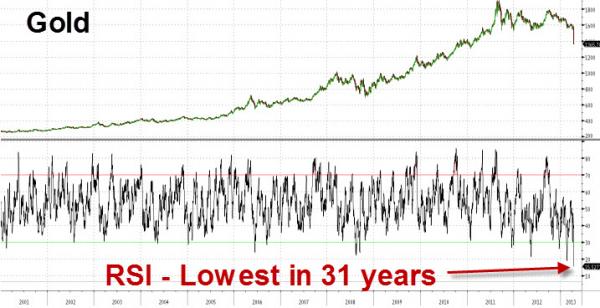
RSI shows gold to be the most oversold in 31 years...
Gold pushes down to the 50%..
Continue Reading
posted by Bramesh at
9:45 AM
![]()
![]()

0 Comments:
Post a Comment
Note: Only a member of this blog may post a comment.
Subscribe to Post Comments [Atom]
<< Home