Nifty Weekly Analysis for Week 09-13 March
Last week we gave Chopad Levels
of 8936 Nifty did 2 target on upside and 1 target on downside in a
volatile week which saw RBI cutting rate. Lets analyze how to trade next
week.

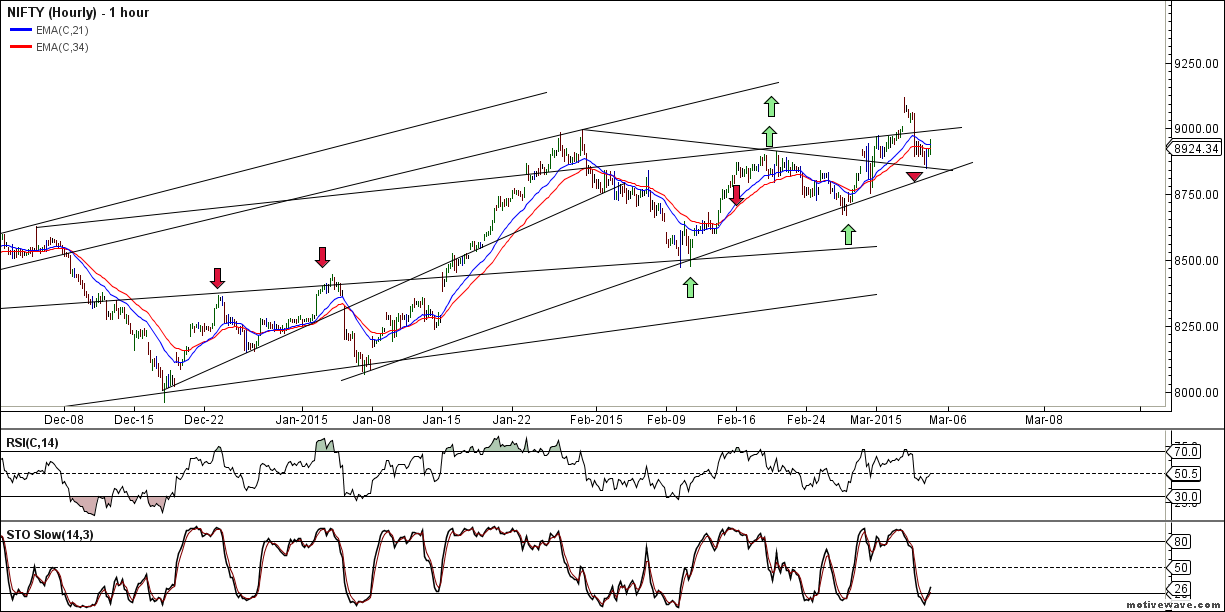
Nifty Hourly charts took support at its lower trendline but closed below its 34 EMA,suggesting weakness on Hourly charts. Break of 8850 will lead to further downfall till 8750/8698. Holding the same 8968/9088 is back on cards.

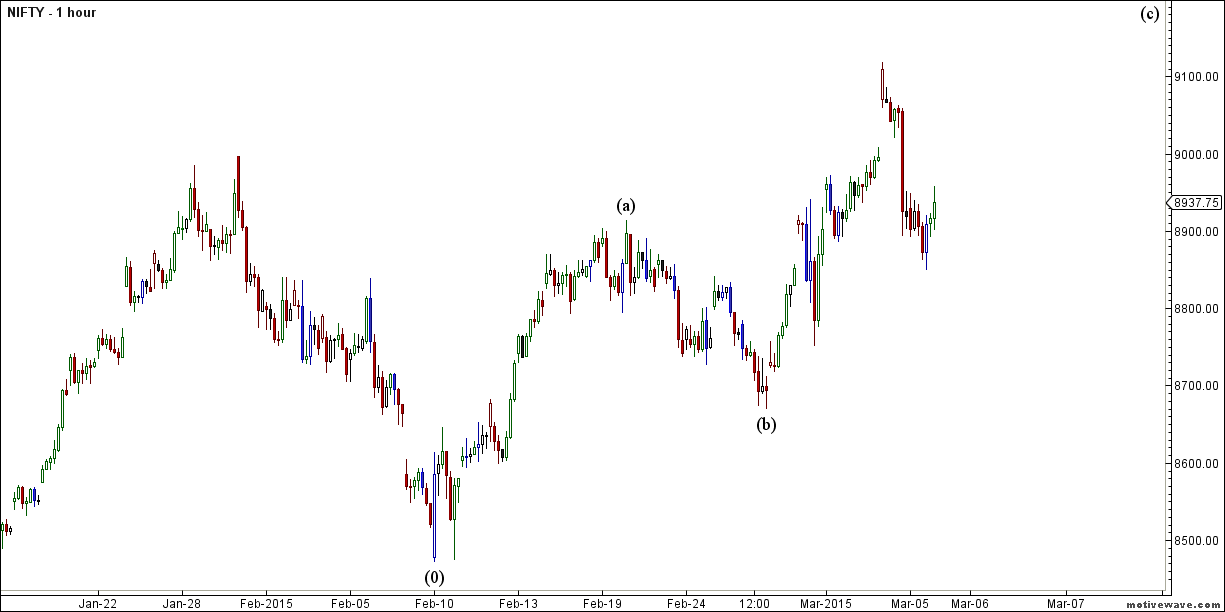
Elliot wave chart on Hourly is shown above suggesting 8850 will play a crucial role in coming week.
Continue Reading
Nifty Hourly Chart

Nifty Hourly charts took support at its lower trendline but closed below its 34 EMA,suggesting weakness on Hourly charts. Break of 8850 will lead to further downfall till 8750/8698. Holding the same 8968/9088 is back on cards.
Nifty Hourly Elliot Wave Chart

Elliot wave chart on Hourly is shown above suggesting 8850 will play a crucial role in coming week.
Nifty Market Profile
Continue Reading
0 Comments:
Post a Comment
Note: Only a member of this blog may post a comment.
Subscribe to Post Comments [Atom]
<< Home