Who Controls the market ? FII/DII or Others - A Statistical Analysis
This is in continuation of the article “Impact of Institutional Investments on NIFTY”
published last week. Data and suggestions compelled me to analyses
further with FII trading as focus area. Will analyzing the mystery of
FII alone throw clues in finding our way in market maze? What will you
think, if you take a closer look at the pie chart below :

The above chart is based on average of daily turnover in NSE since April 2012 to Feb 2015.
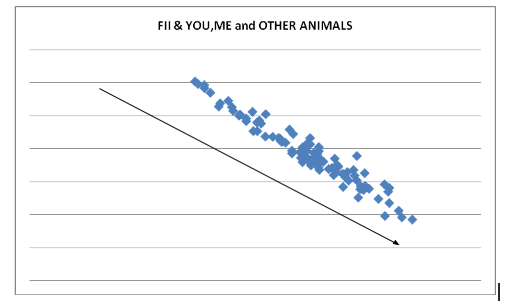
Still not convinced to read further? Then take this. Majority of You, me and the other animals (bulls, bears…) who contribute to the second major share of daily turnover, trade against the big boys. Now, does it sound familiar read with the market gospel that 10% of traders gain what 90% lose? No exaggeration. The data shows existence of a very, very strong relationship between FIIs and the “Others” and the relationship is in OPPOSITE direction. This is deciphered by subjecting the daily trading data of the two segments to statistical analysis of correlation coefficient. It threw a correlation coefficient of -0.97 (negative) existing between the two. (Please refer to last week’s cited article to refresh your memory of this statistical tool). If the data is plotted to create a cluster chart, it creates the below chart.

FII turn over in X Axis and Others on Y, show that on majority times/trades, majority of You and Me trade against the FIIs – one reason for the busted trading accounts that we have missed so long? Why else the market savvy traders keep highlighting on what FIIs did yesterday? Let me be honest.
Continue Reading

The above chart is based on average of daily turnover in NSE since April 2012 to Feb 2015.
Still not convinced to read further? Then take this. Majority of You, me and the other animals (bulls, bears…) who contribute to the second major share of daily turnover, trade against the big boys. Now, does it sound familiar read with the market gospel that 10% of traders gain what 90% lose? No exaggeration. The data shows existence of a very, very strong relationship between FIIs and the “Others” and the relationship is in OPPOSITE direction. This is deciphered by subjecting the daily trading data of the two segments to statistical analysis of correlation coefficient. It threw a correlation coefficient of -0.97 (negative) existing between the two. (Please refer to last week’s cited article to refresh your memory of this statistical tool). If the data is plotted to create a cluster chart, it creates the below chart.

FII turn over in X Axis and Others on Y, show that on majority times/trades, majority of You and Me trade against the FIIs – one reason for the busted trading accounts that we have missed so long? Why else the market savvy traders keep highlighting on what FIIs did yesterday? Let me be honest.
0 Comments:
Post a Comment
Note: Only a member of this blog may post a comment.
Subscribe to Post Comments [Atom]
<< Home