Reliance,Hindalco and Indusind bank Trading Analysis
Reliance Industries

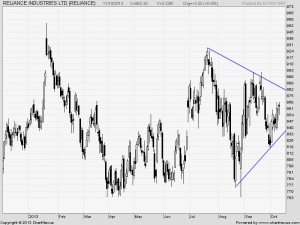
Reliance Industries is Trading in an expanding triangle formation,Strong support at 843 levels and resistance above 898.
Buy above 870 Tgt 875,883 and 890 SL 863
Sell below 860 Tgt 856,848 and 843 SL 863
Indusind Bank
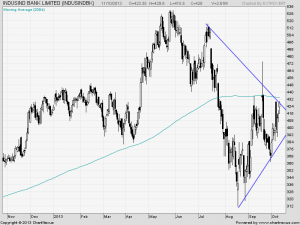
 Indusind bank is taking resistnace at its higher end of trendline,Any close above 434 gives positional target of 466.
Buy above 430 Tgt 433,438 and 445 SL 428
Sell below 427 Tgt 424,420 and 415 SL 429
Hindalco

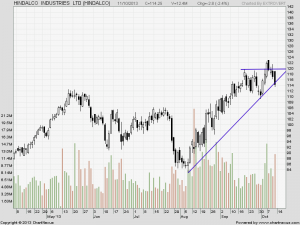
Hindalco is taking support at its upward rising trendline,Holding the same bounceback till 121 can be seen, Any close below 110 will see stock correcting till 105,102 levels.
Buy above 116 Tgt 117.7,119 and 121 SL 115
Sell below 113.5 Tgt 112.2,110 and 108 SL 114.3
Stock Performance Sheet for the Month of September is Updated @http://tradingsystemperformance.blogspot.in/ Net Profit for the month of Sep is 1.82 Lakh and Oct Month 93.5 K
Stock Performance Positional sheet for Sep Month is updated on http://positionalcallsperformance.blogspot.com/ Net Profit for Sep Month 2.35 Lakhs , Oct Month 1.03 Lakh
- All prices relate to the NSE Spot
- Calls are based on the previous trading day's price activity.
- The call is valid for the next trading session only unless otherwise mentioned.
- Stop-loss levels are given so that there is a level below/above, which the market will tell us that the call has gone wrong. Stop-loss is an essential risk control mechanism; it should always be there.
- Book, at least, part profits when the prices reach their targets; if you continue to hold on to positions then use trailing stops to lock in your profits.
0 Comments:
Post a Comment
Note: Only a member of this blog may post a comment.
Subscribe to Post Comments [Atom]
<< Home