Thursday, October 16

Reliance Industries – Reasons for the fall

Reliance Industries Ltd. (RIL) share price has plummeted by about 11% to Rs.1,350 per share today, which is way below promoter’s warrant conversion price of Rs.1,402 per share.

If one may recall, Mukesh Ambani, promoter of RIL had subscribed to 12 crores warrants of the company, to be converted into equal number of shares, at Rs.1,402 per share and total investment was Rs.16,824 crores. When we have seen many promoters not going in for warrant conversion or warrant subscription, this move had imbibed confidence into the market, when the same were converted, in the first week of October 08. Remember, Hindalco Industries promoters have allowed their warrant to get lapsed and have foregone Rs.130 crores paid by them at the time of warrant subscription, which were on 11th April 07, one day ahead of RIL warrant subscription by the promoters, viz. 12th April 07.

RIL share today though opened at Rs.1,465 against it previous day’s close to Rs.1,519, but fell to a low of Rs.1,327 and about 18 lakh shares were traded on BSE till 1 pm at an average rate of Rs.1,373 per share and while about 57 lakh shares on NSE at Rs.1,371 per share. This kind of fall in share price can happen only with delivery based selling, which may have been pressed by the institutional investors.

The stake of domestic mutual funds and insurance companies, in the company as at 30-09-08, is to the extent of about 9% with about 13 crores shares held by them. FIIs have been holding about 17% stake of the company, being 24.67 crore shares on that date, with 1,091 holders. Value of the investment at Rs.1,400 per share works out to Rs.34,000 crores being US $ 7 billion, of FII investors.

In view of FII selling of close to US $ 10 billion till date, in calendar year 2008, in the Indian market, it is feared that selling in RIL stock has been made by these FIIs only, on opening of the market. The same would get confirmed with FII datas to be released by the regulator in the next couple of days.

It is said that FIIs call to press sell button in the stock has nothing to do with the fundamental of the company but compulsion for them to mobilize liquidity at their end, by divesting stake in the frontliners. Due to this reason, we have seen a fall of about 11% in share price of TCS, as FII stake in TCS, as at 30-09-08, has been high at about 11%.

RIL share price was ruling at around Rs.1,400 per share in April 07, when the promoters have gone for warrant subscription, at an effective price of Rs.1,402 per share. RIL share had its 52 week high of Rs.3,252 per share, touched on 15-01-08 with low of Rs.1,327 having touched today. With RIL share price having moved past 3 K in January 08, everyone had praised the move of the promoters, as warrant subscription have made them richer by over Rs20,000 crores. At that time, it was found this to be a visionary move by the promoters as huge jump in the financial performance of RIL was expected, due to commencement of gas production by the company in KG D-6 block as also its subsidiary Reliance Petroleum, starting commercial production of its refinery at Jamnagar, way ahead of its scheduled date of December 08.

Now, the market is attributing reason for divesting the stake by FIIs due to concern on margins and profitability by RIL in the coming quarters. Expectations of fall in GRM due to softening crude prices as also steep fall in global petrochemical demand are seen as two main reasons. Though RIL has been able to maintain its volume and margin growth in Petchem segment, the same looks doubtful in the coming quarters. Even GRM, which has been ruling above $15 per barrel is likely to fall to $12 per barrel in Q2 and may head to touch in single digit by the end of 4th quarter of FY 09.

RIL for FY 08, had posted an EPS of Rs.105, before extraordinary items and mainly from its core business. EPS for June 08 quarter was placed at Rs.28.30 and it was expected that the same is likely to be about Rs.115,in FY 09, from its existing business thus giving a growth of slightly lower than 10% over FY 08. But now the same expectations may not hold true in view of concern stated above. Also it is expected that no significant contribution in FY 09 would come from RPL Refinery or KG Basin Gas Production. Both the projects would contribute in FY 10 only, may be for entire 12 months.

However, the contribution from both the new projects, in FY 10, though are difficult to assess now, but one can expect RIL to post an EPS of close to Rs.200 for FY 10. If we go by the same estimates the share is now ruling at a PE multiple of less than 7. Does this valuation makes the stock expensive?

In the scenario, we don’t think that fundamentals have any role to play when liquidity and sentiments are the dominating factors.
Tuesday, October 14

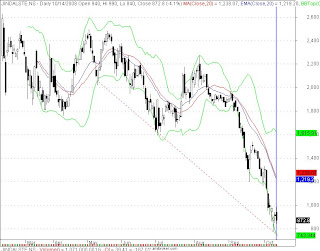
Selling Excepted in Jindal Steel below 848

Investment Idea: MOSER BAER INDIA LIMITED (MBIL)

MOSER BAER INDIA LIMITED (MBIL) is a global technology company with presence in over 82 countries, and services through six marketing offices in India, the US and Europe. Incorporated in 1983, today it is India's largest and the world's 2nd largest Optical Storage Media (OSM) manufacturer and enjoys strong tie-ups with all major global technology brands. It is also India's largest home entertainment Company. It releases video content in the DVD and VCD formats using proprietary and patented technology that ensures the highest quality standards at affordable prices. It is also the first storage media Company in the world to make commercial shipments of HD (high density) DVDs. Moser Baer has also established itself as a major player in the USB drives and memory cards. Its foray into PC peripherals in the form of ODDs (Optical Disk Drives) will further help it strengthen its position in the industry. Currently the IT vertical industry (PCs and Notebooks) is pegged at Rs 20000 Crores and the PC Peripheral industry is worth Rs 12000 Crores. Moser Baer with its entry into the ODD Market in the form of Combo Drives and DVD Writers plans to capture 20% market share of present Indian market size of five lakh units per month. Recently, the company has transformed itself from a single business into a multi-technology organisation, diversifying into exciting areas of Solar Energy, Home Entertainment and IT Peripherals & Consumer Electronics.

Investment Rationale


· FY 2008 AND Q1 FY 2009 PERFORMANCE OVERVIEW: The Consolidated Net Sales of the Company increased from Rs. 1984.04 Cr to Rs 2070.01 Cr during FY 2008, an increase of 4.33% YoY. The Consolidated Core EBITDA stood at Rs. 223.96 Cr in FY 2008 as against Rs. 433.83 Cr during FY 2007, down 48.34% YoY. The Consolidated Net Loss for the year stood at Rs 431.85 Cr against Rs 60.88 Cr in FY 2007, an increase of 609% YoY. The Standalone Net Sales stood at Rs. 1892.59 Cr. during FY 2008 as against Rs. 1981.91 during FY 2007, down 4.5% YoY. The Standalone Core EBITDA stood at Rs. 302.37 Cr. during 2008 as against Rs. 460.25 Cr. during 2007, down 34.3% YoY. The Standalone Net Loss of the Company is Rs. 310.52 Cr. for FY 2008 as against Rs. 32.18 Cr. during 2007. The Standalone Net Sales of the Company increased to Rs. 478.93 Cr in Q1 FY 2009 as against Rs. 469.30 Cr during Q1 FY 2008, a growth of 2.05% YoY. The Standalone EBITDA for the quarter stood at Rs. 53.46 Cr. as against the Standalone EBITDA for the same quarter last year of 152.08 Cr down by 64.85%. The Standalone Net loss for the same period increased to Rs. 103.98 Cr as against Rs. 71.72 Cr in the last quarter of 2007-08 an increase of 45%. The net loss includes a loss of Rs. 28.27 Cr on account of the adverse movement of foreign exchange.

· INNOVATIVE PRODUCTS TO CATER GROWTH: Moser Baer recently acclaimed fame of being the first non-Japanese Company to innovate its own OSM blu-ray disc technology. The demand for these blue laser based formats is expected to exceed over 12 Crore discs by 2009 from less than a crore units at present. The concept works on blue laser, which used to read and write this type of disc. Because of its shorter wavelength (405 nm), substantially more data can be stored than on the DVD or CD formats (which uses 650 nm and 780 nm wavelength respectively). A dual layer Blu-ray Disc can store upto 50 GB; almost six times the capacity of a double dual layer DVD. The company has an advantage of being "first-to-market" and is well positioned to capture a significant share of this emerging opportunity. The intellectually strong position in the development of this next generation product provides a significant competitive edge.

· HUGE MARKET SIZE; POISED TO GROW EVEN FURTHER: The size of the blank optical media market in India is over one billion discs per annum. CDR (Compact Disc-Recordable) is the predominant format accounting for about 80% of the OSM market in India. DVDR (Digital Video Disc-Recordable) has grown exponentially over the last year. The overall Indian market for OSM is growing at 15% with DVD growing at a pace faster than the industry (it grew at around 100% YoY in FY 2008 and is expected to continue growing at even higher rates in future).

· EMBEDDED VALUE IN SUBSIDIARIES: Moser Baer Photovoltaic Limited, a WOS of Moser Baer India, is in the business of photovoltaic (PV) cells and modules. MBPV is expected to emerge as a technology-driven PV equipment manufacturer in the world by implementing a capacity of 500 MW by FY 2010; through a mix of multiple technologies including crystalline silicon, concentration and thin films. The manufacturing facilities are housed in a SEZ dedicated for renewable energy at Greater Noida. MBPV is in the process of setting up India's largest grid connected solar farm in Rajasthan with an investment of around Rs 100 Crore. Driven by recent significant technological advancements, it is estimated that the solar market will have a 43% CAGR over FY 2008 - 2012 and is poised to achieve grid parity in the short to medium term. Current demand projections translate to a value of US$ 50-70 billion by 2010. Another subsidiary, PV Technologies India Limited (PVTIL) has successfully completed deposition trials for Gen 8.5 a-Si (Amorphous Silicon) thin film modules at its new 40 MW facility in Greater Noida in FY 2008 and thus achieved a global landmark. The company is setting up a thin film PV plant near Chennai with a proposed 500MW annualised capacity. The Chennai and the Greater Noida plants will be manufacturing Gen 8.5 thin film panels measuring 5.72 square metres. The utility of using thin films includes savings of material, monolithic device design, use of inexpensive substrates, and manufacturing processes that need low temperature and are possible over large areas. Photo Voltaic Technologies India recently signed a MoU with a global equipment supplier to secure supply of critical equipment for an additional 565 MW phased expansion of its Thin Film photovoltaic modules manufacturing capacity, which together with the current project capacity of 40 MW will take the total manufacturing capacity to over 600 MW by 2010.

· INTEGRATING OPERATIONS THROUGH ACQUISITIONS: Moser Baer's acquisition of an 81% stake in OM&T B.V., a highly specialized technology Company based in The Netherlands, has started bearing fruits in terms of exploiting cutting edge technologies in both the optical and solar photovoltaic (PV) segments. This acquisition is a major milestone for Moser Baer as it will facilitate strategic implementation and ensure the presence in both the optical and solar photovoltaic (PV) segments. This acquisition will complement the existing research being done at R&D facility based in India and help the company to further consolidate its leadership position. According to the agreement, all innovations by OM&T will be transferred to Moser Baer. The Joint venture will also focus on development of photovoltaic technologies to support Company's existing PV business.

· GOVERNMENT ASSISTANCE: Indian government would provide financial assistance amounting to Rs.12 (30 cents) per kWh in case of solar photovoltaic and Rs.10 per kWh in case of solar thermal power fed to the electricity grid. The scheme will be run by the Indian Renewable Energy Development Agency (IREDA), and solar farm developers will be able to access the subsidy by selling their energy to state-run utilities under the new tariff. The incentives are scheduled to run for 10 years and will be paid in addition to any subsidies offered by state governments. Some of the Indian states have also announced independent programmes to support large size solar PV installations. However, the ministry has imposed a limit for the incentives of 50 megawatts in total, a cap of 10 megawatts (MW) within any one state and a maximum of five megawatts per developer.


Conclusion


The company is incurring losses since last three quarters on high operating expenses due to foray in new business areas. However, we believe that solar division will add significantly to the top-line of the company. Recently, the company sold 6.5% of its Photovoltaic Divison in a private equity deal to a group of foreign and domestic investors for Rs 411 crore, valuing the division at Rs 6,350 crore. This is significantly higher than the total market capitalization of the company i.e. Rs 1620 crore. The stock currently trades at Rs. 96.25. We expect that the stock could be a multi-bagger. We recommend a BUY on the stock with a time horizon of 24 months and a price target of Rs. 173, offering a return potential of 80% from the current levels.

INTRA CaLL

Buy Bharti Airtel at the current price with a stop of Rs.734. The stock may breeze to Rs.774/782 shortly.

Sunday, October 12

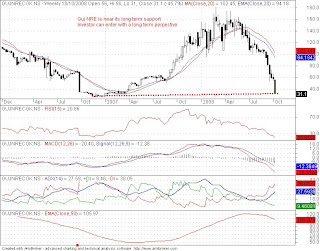
Guj NRE is at its long term support Can Enter

OutLook For 13-17 Oct

NIFTY OI PCR IS LOWEST SINCE JUNE 15, 2006-A RAY OF HOPE FOR Recovery
Nifty Oct call added 17% in OI at 2.98 Cr shares while put shed 22% in OI at 1.50 Cr shares. On the back of this call writing at higher level strikes and covering of positions by the put writers as they fear sharp short covering rally, one should keep in mind that during the month of June 06 it had fallen to as
low as 0.60 level before it saw some recovery.

Buy Nifty call 3900 Nov and Hold till expiry
Nifty faces Support now at 3200 than at 3000 which is shown in charts in previous post.

Stock Specific

Real State Stocks will show Lot of Momentum Unitech go long above

IVRCL BUY above 165 Sl 150 Gaps need to be filled

DLF buy above 307

Unitech above 95

HDIL is having a book value of rs 169 so its no man guess its a value buy at these levels Buy only in stagger manner.

Reliance Buy in stagge manner around 1300-1500 Levels for Long term.

SBI sell at Rise for a tgt of 1000 sl 1400

ICICI Bank a value Pick from trading prospective BUY it above 372 for a tgt of 400 and 425

Well guys will tell u one thing which all should agree

Investor and Traders do not sell in Loss but sell in PANIC

Any Stock Specific query mail at bhandaribrahmesh@gmail.com

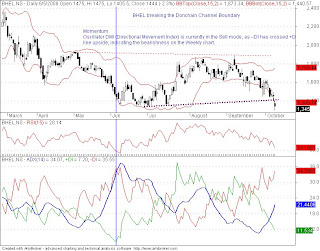
BHEL Sell with SL 1350 TGt 1245 and 1220

Saturday, October 11


Friday, October 10

CRR cut by RBI – 60000 Cores Back in System

Reserve Bank of India (RBI) with a view to inject liquidity in the system has proposed another CRR cut of 100 basis point (bps) in addition to 50 bps made last week. Aggregate cut of 150 bps in CRR, would inject a liquidity of Rs.60,000 crores in the banking systems. Against borrowings of upto Rs.90,000 crores by the banks, currently from RBI, this liquidity injection in the system would come as a big relief for the banking sector in the country.


However, this liquidity may not see or give any big relief to Auto or Housing Sector but may encourage the bankers to atleast release the drawing powers to industries, which were put on hold or have been freezed by them. This would lubricate the liquidity crunch now being faced by the industries like Automobiles, Metals, Auto Ancillaries and Chemical Industry.


The cut in CRR has become necessary for RBI as they have no other option to infuse liquidity in the System Cut in Repo rate cannot be expected from RBI at this stage in view of inflation still hovering close to 12 per cent. If we do not see a significant improvement in the liquidity in the system, a further 50 bps cut in CRR is not ruled out. Cut in Repo rate would come only in January 09.


With a view to stabilize the rupee, RBI has been selling dollars in the market, which has sucked out liquidity in the system, with rupee having depreciated by about 20 per cent in the last four months, the demand for dollar remained at the higher levels, by the importers and oil marketing companies, as currency weakness has neutralized the effect of falling commodity prices.


Though other countries have been going in for rate cut, Indian Banking Regulator – RBI, still has its focus set on price stability and control of inflation, as they have target to bring it down, to single digit by end of January 09. This objective would get achieved if the rupee stops depreciating beyond a point and may even settle at Rs.48 a dollar. Once the outflow by FIIs also tapers off from the Indian stock markets, the relief to rupee may come and this may help it to settle at around 48 and may not find it touching 50 levels.


Due to weak rupee, we have started witnessing good NRI Deposits to our commercial banks.


In the current situation of turmoil, nothing much is expected from SEBI as short selling ban would not help at this stage. Even nothing much can be expected from Finance Ministry or by the government as any ad-hoc relief in the form of sector – specific reliefs or reduction in indirect taxes to any one sector may create dissatisfaction amongst the other sectors or industries not receiving it.


However, on long term basis lot of policy review and changes are required in terms of fiscal management, FDI and FII Inflow rules, hike in FDI limits in various sectors, subsidy disbursement policy for fertiliser and oil sector as also bringing in pricing norms for primary markets to protect the interests of small investors etc.


However, with global markets seems to have reached at its bottom in view of whatever worst had to come having been surfaced, we should see our markets now settling at its bottom, which could be held at the levels of 10K for Sensex and at 3K for Nifty. Though one may not be in a position to take a call when we would start recovering but even if we remain settled at these levels for about 4 weeks and taking cues form Q2 results, we can expect value based buying coming in from our domestic investors in a small way post Diwali.


In the present time of crisis, this CRR cut of 100 bps (with earlier cut of 50 bps and now at 150 bps cut) by RBI would give a relief and this move needs to be praised.

Recovery on Cards

CBOE VIX weekly chart: On most occasions, whenever the VIX IDX hastouched an intermediate high, it’s normally followed by a rally in the US markets. This timetoo, with the VIX hitting a life time high, we may see the US markets producing a bounceback, though it should be clearly stated that such an up move would be purely technical in nature

Monday, October 6

PART II - Bear Market 2000-2002: Replay in 2008


Now lets look at weekly chart of Nifty in 2008; and try to spot similarities between what happened in 2000-2002 and what scenarios can play out now.


Let's compare 2000-2002 period with current period of 2008 and what scenarios can play out of it's the exact repeat of 2000-2002 period.

2000-2002 Bear Market

1. Nifty peaked in Feb 2000

2. It took 8 months for the market to slide to 200 week moving average (Feb 2000 to October 2000)

3.Price correction to 200 week ma from peak = 36%

4.There was 20% bounce after market touched 200 week ma and it happened during Oct-Feb which is good period of equities.

5.The market then tumbled below 200 week moving average in March 2001.

6.The market sharply tumbled 30% on break below 200 week moving average.

7.Time Correction - It took 29 months for market to recover once market slipped below 200 week ma. It was a painful slow recovery

8. The bull market resumed when market finally broke out above 200 week ma


Anticipated 2008-2010 Bear Market

1.Nifty peaked in Jan 2008

2.Nifty is about to touch 200 week ma and it's already 9 months (Jan 2008 - Sep 2008)

3. Price correction to 200 week ma from peak = 42% (not reached to 200 week ma)

4. May Happen ...It means market may bounce from 3650 to 4500 levels in next 3-4 months...pre-election/seasonal rally

5.The next wave of correction may come in Feb-March 2009 just before elections and market can slip below 200 week ma

6. Quite possible during elections - Nifty can tumble 20 to 30% below 200 week ma

7. The real bear market painful period may come in 2009-2010 period and bull market may resume in 2011

8. 200 week ma can be a pivot point for next bull run


It means we may see a strong bounce in next 3-4 months before we see another sharp correction.

Bear Market 2000-2002: Replay in 2008


Global markets are in midst of a severe sell off. We are in a terrible bear market, and the question we need to ask - Is this the repeat of bear market of 2000-2002?

The answer is may be YES.

There is amazing similarity you can spot on charts between what is happening now and what happened in 2000-2002. The image above is the Nifty weekly chart of 2000-2002 period -


As you can see in the chart above, the 2000-2002 bear market was not only painful in terms of price correction but also time correction. Here are some facts -

o Nifty peaked in Feb 2000

o It then took 8 months for the market to slide to 200 week moving average. The price correction was 36% and it happened between Feb 2000 and October 2000.

o The market then bounced back from 200 week moving average - 20% bounce. This was Oct-Feb period - generally good period of equities

o The market then tumbled below 200 week moving average in March 2001.

o The market sharply tumbled 30% on break below 200 week moving average.

o Time Correction - It took 29 months for market to recover once market slipped below 200 week ma. It was a painful slow recovery.

o Every rally below 200 week ma got arrested at 200 week ma during those 29 months of recovery.

o The bull market resumed when market finally broke out above 200 week ma in August 2003.

Ironically now, a similar story is getting played out in 2008. FYI - 200 week moving average = 3648. This level also coincides with 50% retracement of bull run from 920 to 6300.

Sunday, October 5

Outlook for next week 06-10 OCt

Nifty views are updated in previous post.

Nifty can see a sharp pullback from 3650-3700 Level,Aggressive Put Writing is observed at this level.

Buy some 4000 call at Nifty around 3700-3750 Levels

Upside is limited to 3990 where 38.2% Retracement lies and 4009 where 50% lies.


Stock Specific


Reliance is a Buy at 1700 levels 30% and hold them more can be added at 1500 levels

SBIN stock is not breaking 1484 levels once it close below 1470 we can see a good downside coming till 1400.

Short SBIN above 1525

BHEL was a strong stock on Friday Wait for a correction and enter the stock at 1450 for a tgt of 1500 and 1550

Punj Lloyd
The daily MACD is exhibiting negative divergences along with a
crossover sell signal. This suggests that the trend is weakening. A
break below Rs260 levels will see the stock correcting for potential
target of Rs230 and Rs210 levels.
The stock has been consistently closing below its short and near
term averages for the past few sessions which suggest that the
stock is set to break below the 260 support levels. Keeping in mind
the above mentioned technical evidences, we recommend traders
to sell the stock at current levels and on rallies to resistance of Rs276-
280 levels for target of Rs210. A stoploss above Rs286.5 is
recommended on all short positions.

Divis Lab short at 1300 Levels for a tgt 1200 and 1000 Stop Loss 1321

Kotak bank sell below 531.50 sl 537 Tgt 520 and 508


Market Rumors

GVK power is going to enter atomic power plants.

HUL may declare 1:1 bonus.

Titan is sitting on very large reserve. A bonus is a clear posibility in near future.

Promoters of Premier Exploives are buying shares from the open market

Will 700 Billon Dollar help:Data from past Bubble Burst

The US$ 700 billion bailout, the US government claims, is essential
to revive the economy. While the long term impact will have to be
seen, the near term impact will be nothing more than a short term
reprieve for the market which would fade away quickly.
The bailout package will put pressure on the Dollar's exchange rate
and cause inflationary trends in the US economy. A look back at
bailouts elsewhere reveals that such measures haven ít exactly
proved to be the best medicine. In 1980s, the economies of Sweden,
Norway and Finland had expanded drastically due to deregulation
and low interest rates. With the burst of reality and stock market
bubble a high debt burden was becoming difficult to sustain in the
three economies. Measures similar to the Fed's were taken but
proved unsuccessful.

For example the Swedish government raised a US$14bn
restructuring fund to guarantee bank obligations and created an
organization to buy assets at a discount. Norwegian government
took over the three largest banks while the Finnish government
merged 40 banks into one entity. The moves by the three countries
failed to yield immediate results as consumer spending fell and banks
reduced lending. In fact, Swedish and Finnish economies shrunk
for three consecutive years. The US is facing a once in a century
crisis, which will not vanish overnight.


So situation is still precarious as the extent is still know lets wait and watch

Friday, October 3

US bailout package 700 Billion Dollar impact

The US Senate passed a $ 700 billion financial market rescue package on a 74-25 vote, authorizing the government to buy troubled assets from financial institutions rocked by record home foreclosures.


However, financial analysts across the globe are not too pleased with this bailout package, as, they feel that the losses could be to the extent of US $ 1.5 trillion. The market is also perturbed over the rising unemployment datas, coupled with falling factory orders which would ultimately lead to a fall in corporate profits.

There has been numerous negative arguments put forth saying that this bailout package may not be enough to rescue US financial companies out of its abyss, which may be right. But we need to look at it from another angle that, if this package were not to come about, an irreparable damage would have been caused, spreading it across the globe and damaging the economies of the emerging markets most, including India.

This package would enable the financial companies to inject the desired liquidity into the system and avoid distressed sale of assets, which otherwise would have happened, in the event of Investment Bankers and companies going bankrupt. Also, even if we assume that the funding gap is to the extent of US $1.5 trillion, atleast this package is to the extent of 50%. No one can really expect the entire relief to come in one go and even US $700 billion getting infused in the system, may control the damage to a great extent and at some point, it may come on its own and be self-sustaining. This fund infusion would greatly help to restore the confidence amongst the banks, as they are presently not willing to lend inter-se, suspecting the creditworthiness of each other.

In Indian stock market, FIIs have investment to the extent of U S $50 billion in equities, of which over; 50% is via participatory notes, which we have been seeing moving from one distressed FII to another healthy one. In the year 2008, FIIs have already sold Indian paper of close to US $ 9 billion, which now leaves small portion remaining invested. Obviously, one cannot really expect the entire FII portfolio getting liquidated, as all of them are not feeling the heat and are hard pressed to exit from emerging markets, including India.

This bailout package can be compared with the BIFR Rehabilitation package having been given to the Indian Corporates in the period between 1996 to 2003. Who would have imagined that a company like Jindal Vijaynagar Steel saddled with debt of close to Rs.5,000 crores with accrued interest thereon of an equal amount would be able to come out of the mess. Once a complete waiver of accrued interest and part waiver of principal were given to these companies, they regained their lost vitality.

In this situation, the brunt of the economy debacle were widely shared by financial institutions and banks, which were largely owned by the government. So, indirectly the relief in the form of rescue package came from the government, and that was the reason, which had kept the stock prices of PSU Banks ruling below its face value. Classic case was that of Bank of India, when it was ruling below Rs.10 and of Indian Bank, which had incurred a loss of over Rs.2,000 crores in one year alone. Most of these PSU Banks, had NPA of 10% and above and investors were not prepared to invest in the stocks of these PSU Banks, and have totally written them off.

A point, which we are trying to push here, is to show the benefits of fund infusion and waiver or grants, which are ultimately borne by the exchequer. It may take about 6 to 12 months of bailout funds to properly move into the system, which will re-lubricate the whole system and would bring back the economy on its track.

Even in US very few banks like Bank of America, J P Morgan, Citibank, or Goldman Sachs have remained in the fray who will ultimately be sharing the larger piece of the cake of the same size.

One argument cited against this US bailout package is that of comparing it at 5% of US GDP, which is at US $ 14 trillion. It is foolish to do so as one cannot expect the entire GDP of a country getting eroded or expecting an infusion of an equivalent amount in the system. Alternatively, one can compare it with the annual fiscal deficit of US economy, which is at around US $ 500 billion and this package exceeds the one-year deficit.

In Indian context, fiscal deficit of US $ 25 billion is expected in our budget for year 08 -09, which is at 2.5% of GDP. In realty, it would exceed over 8%, as fertilizer subsidy and oil companies under recovery itself could be over US $ 60 billion, which is equivalent to about 6% of the GDP.

Every coin has its two sides and one may argue for the sake of argument as one looks at it but the bail-out package is likely to have positive implications, which are likely to reflect in the next 6 to 12 months, especially for the emerging markets, including India.

Thursday, October 2

8 reasons why stock market traders lose money

Many people think trading is the simplest way of making money in the stock market. Far from it; I believe it is the easiest way of losing money. There is an old Wall Street adage, that "the easiest way of making a small fortune in the markets is having a large fortune."
I discuss below eight ways of undisciplined trading which lead to losses. Guard against them, or the market will wipe you out. I am qualified to speak on this subject because I was myself an undisciplined trader for a long time and the market hammered me into line and forced me to change my approach.

1. Trading during the first half-hour of the session
The first half-hour of the trading day is driven by emotion, affected by overnight movements in the global markets, and hangover of the previous day's trading. Also, this is the period used by the market to entice novice traders into taking a position which might be contrary to the real trend which emerges only later in the day.
Most experienced traders simply watch the markets for the first half of the day for intraday patterns and any subsequent trading breakouts.

2. Failing to hear the market's message
Personally, I try to hear the message of the markets and then try to confirm it with the charts. During the trading day, I like to watch if the market is able to hold certain levels or not.
I like to go long around the end of the day if supported by patterns, and if the prices are consistently holding on to higher levels. I like to go short if the market is giving up higher levels, unable to sustain them and the patterns support a down move of the market.
This technique is called tape watching and all full-time traders practice it in some shape or form. If the markets are choppy and oscillate within a small range, then the market's message is to keep out.

Hearing the message of the market can be particularly important in times of significant news. The market generally reacts in a fashion contrary to most peoples' expectation. Let us consider two recent Indian events of significance.
One was the Gujarat earthquake that took place on 26 January 2001 and the other the 13 December 2001 terrorist attack on the Indian parliament. Both these events appeared catastrophic at first glance. TV channels suggested that the earthquake would devastate the country's economy because Gujarat has the largest number of investors and their confidence would be shattered, making the stock market plunge.
Tragic as both the events were, the market reacted in a different way to each by the end of the day. In both cases the markets plunged around 170 points when it opened, in both cases it tried to recover and while it managed a full recovery in the case of the Gujarat earthquake, it could not do so in the Parliament attack case.
The market was proven correct on both counts. The Gujarat earthquake actually held the possibility of boosting the economy as reconstruction had to be taken up, and also because most of the big installations, including the Jamnagar Refinery, escaped damage. In the case of the attack on parliament, although traders assessed that terrorist attacks were nothing new in the country but the market did not recover because it could see some kind of military build-up ahead from both India and Pakistan. And markets hate war and uncertainty.
In both these cases what helped the cause of the traders were the charts. If the charts say that the market is acting in a certain way, go ahead and accept it. The market is right all the time. This is probably even truer than the more common wisdom about the customer being the king. If you can accept the market as king, you will end up as a very rich trader, indeed.
Herein lies one reason why people who think they are very educated and smart often get trashed by the market because this market doesn't care who you are and it's certainly not there to help you. So expect no mercy from it; in fact, think of it as something that is there to take away your money, unless you take steps to protect yourself.

3. Ignoring which phase the market is in
It is important to know what phase the market is in -- whether it's in a trending or a trading phase. In a trending phase, you go and buy/sell breakouts, but in a trading phase you buy weakness and sell strength.
Traders who do not understand the mood of the market often end up using the wrong indicators in the wrong market conditions. This is an area where humility comes in. Trading in the market is like blind man walking with the help of a stick.
You need to be extremely flexible in changing positions and in trying to develop a feel for the market. This feel is then backed by the various technical indicators in confirming the phase of the market. Undisciplined traders, driven by their ego, often ignore the phase the market is in.

4. Failing to reduce position size when warranted
Traders should be flexible in reducing their position size whenever the market is not giving clear signals. For example, if you take an average position of 3,000 shares in Nifty futures, you should be ready to reduce it to 1,000 shares.
This can happen either when trading counter trend or when the market is not displaying a strong trend. Your exposure to the market should depend on the market's mood at any given point in the market. You should book partial profits as soon as the trade starts earning two to three times the average risk taken.

5. Failing to treat every trade as just another trade
Undisciplined traders often think that a particular situation is sure to give profits and sometimes take risk several times their normal level. This can lead to a heavy drawdown as such situations often do not work out.
Every trade is just another trade and only normal profits should be expected every time. Supernormal profits are a bonus when they -- rarely! -- occur but should not be expected. The risk should not be increased unless your account equity grows enough to service that risk.

6. Over-eagerness in booking profits
Profits in any trading account are often skewed to only a few trades. Traders should not be over-eager to book profits so long the market is acting right. Most traders tend to book profits too early in order to enjoy the winning feeling, thereby letting go substantial trends even when they have got a good entry into the market.
If at all, profit booking should be done in stages, always keeping some position open to take advantage of the rest of the move. Remember trading should consist of small profits, small losses, and big profits. Big losses are what must be avoided. The purpose of trading should be to get a position substantially into money, and then maintain trailing stop losses to protect profits.
Most trading is breakeven trading. Accounts sizes and income from trading are enhanced only when you make eight to ten times your risk. If you can make this happens once a month or even once in two months, you would be fine. The important point here is to not get shaken by the daily noise of the market and to see the market through to its logical target.
Remember, most money is made not by brilliant entries but by sitting on profitable positions long enough. It's boring to do nothing once a position is taken but the maturity of a trader is known not by the number of trades he makes but the amount of time he sits on profitable trades and hence the quantum of profits that he generates.

7. Trading for emotional highs
Trading is an expensive place to get emotional excitement or to be treated as an adventure sport. Traders need to keep a high degree of emotional balance to trade successfully. If you are stressed because of some unrelated events, there is no need to add trading stress to it. Trading should be avoided in periods of high emotional stress.

8. Failing to realise that trading decisions are not about consensus building
Our training since childhood often hampers the behaviour necessary for successful trading. We are always taught that whenever we take a decision, we should consult a number of people, and then do what the majority thinks is right. The truth of this market is that it never does what the majority thinks it will do.
Trading is a loner's job. Traders should not talk to a lot of people during trading hours. They can talk to experienced traders after market hours but more on methodology than on what the other trader thinks about the market.
If a trader has to ask someone else about his trade then he should not be in it. Traders should constantly try to improve their trading skills and by trading skills I mean not only charting skills but also position sizing and money management skills. Successful traders recognise that money cannot be made equally easily all the time in the market. They back off for a while if the market is too volatile or choppy.

Excerpt from: How to Make Money Trading Derivatives by Ashwani Gujral.

Buying is advised in Bank of India once it crosses 295


Buying is advised in Bank of India once it crosses 295 and Buy at 252-260 Levels at bad days for a tgt of 295

IT STOCKS – FROM “MOST FAVOURED” TO “LEAST FAVOURED”

IT stocks have been hammered down mercilessly by the punters over the past few days. Stocks which were touted as blue chips are today being sold off by investors. Well, if legendary institutions like Lehman and Morgan can collapse, can we say even talk about blue chips today?


So why have the markets turned sellers on the IT counter? Falling rupee, US crisis, liquidity issues, hike in interest rates, inflation; anything and everything seems to be responsible. When the markets crashed three days ago, IT stocks, along with realty led the fall.


In the meltdown on 29th September, TCS was amongst the biggest losers of the day and it touched a new low at Rs. 612.10. Satyam also touched a new 52-week low at Rs.289. Infact 150 stocks hit a new low that day and prominent IT stocks amongst them were Patni Computers, 3iInfotech, eClerx, Hexaware and Mindtree.


The quake on Wall Street has rattled the Indian IT companies as they earn roughly half their revenue from US. With a further slowdown seemingly inevitable, there is no doubt that business is expected to take a hit. No doubt, when the rupee appreciated last fiscal, to reduce their dependence on the US dollar and to spread their risks, IT companies had started exploring markets in Europe, Middle East and Asia. So companies which have managed to spread their tentacles and reduced their dependence on USA would be impacted slightly lower. Yet, the current crisis is not about the dollar alone, it has affected BFSI business all over the world, so irrespective of the region, business is expected to face a slowdown.


What came as a complete shocker were the front liners hitting a new low. So what exactly was the cause? There is widespread fear that the meltdown in the US financial system is expected to hit the business of IT firms badly as quite a sizeable chunk of their income comes from US banking, financial and insurance sector (BFSI). Infact around 40% of TCS revenue comes from BFSI. TCS is stated to have the highest exposure to the BFSI sector and with this crisis and spate of bankruptcies, naturally, all were in a tearing hurry to offload TCS as quickly as possible. Of the top five Indian IT companies, TCS services Morgan Stanley while Goldman Sachs is an important client for Infosys.


Ironically, Satyam is stated to have the lowest exposure to US, yet it touched a new low. Across-the –board-selling and there was so much panic that the trader just did not want to wait on the IT counters, irrespective of the companies exposure to US.


What about Infosys? During the first quarter ended 30th June 2008, 35% of the company’s revenue came from BFSI which was at around 36% for FY08. Infosys services 6 of the 7 large US banks, 6 of the top 10 securities firms, 4 of the top 5 European banks, 6 of the 8 top mortgage orginators. How many of them exist today? US accounts for 60% of the company’s revenues; that somehow no longer seems reassuring, it has infact become a cause for worry.


To make matters worse, National Association of Software and Service Companies (Nasscom), in a recent report has stated that growth of Indian software and services could be slower than expected in 2008/09 and it is expected to revise its growth projections in December. It had forecast revenue growth between 21% - 24% to about $50 billion in FY09. The third and fourth quarters are expected to be exceptionally difficult.


There is no doubt that given the current scenario, business is bound to take a hit. Re-negotiations and new negotiations would be put off for some time. This fiscal, FY09, despite the dollar appreciation, would be tough on the Indian IT companies. The short to medium term outlook for IT companies does look bleak. The market is always right; we just have to learn to look at the indicators to know the reasons. Infosys is to declare its results on 10th October. That will give us the cue for the fiscal.