Sunday, June 29

Bank Nifty Weekly Analysis as per Elliot wave and Gann

Last Week we gave Bank Nifty Chopad level of 15046 and Bank Nifty did all 2 target on upside and 1 target on downside. We have Union Budget coming on 10 July so Bank Nifty will be in focus for next week and big moves are on cards. Lets analyze how to trade Bank Nifty in coming week.

Bank Nifty Hourly

Bank Nifty Hourly
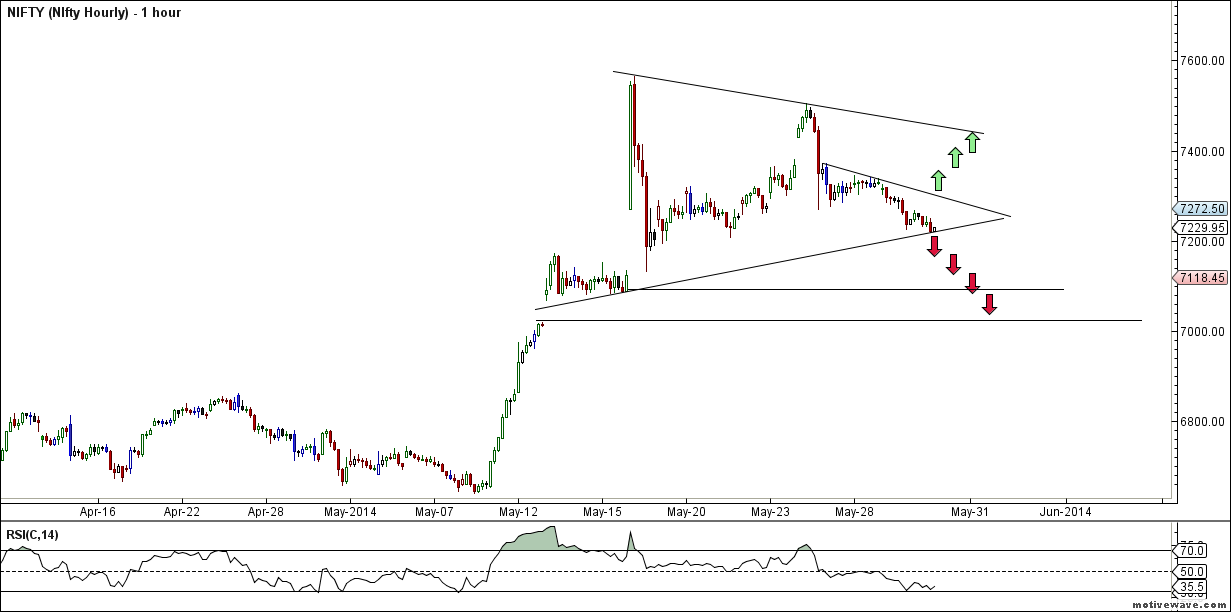
Bank Nifty hourly charts is trading in a range, 15600- 14933. Breakout above 15600 for a target of 15750.Breakdown below 14933 for target of 14700.

Bank Nifty Hourly Elliot Wave

Bank Nifty Hourly EW
Elliot wave target for Bank Nifty comes around  ..
Continue Reading

Nifty Weekly Analysis as per Elliot wave and Gann

Last Week we gave Chopad level of 7506, Nifty did 1 target on upside and 1 target on downside in a highly volatile week. Worries of deficient rainfall, Iraq war and its effect on Brent Crude has kept markets on edge. .Lets analyze how to trade Nifty in expiry week.

 Nifty Hourly Chart

nifty hourly
Hourly charts are still trading in range, Range contraction is happening at present, Momentum will come below 7474 on downside and 7600 on upside.

Nifty Elliot Wave Analysis

Nifty Hourly EW
As per Elliot wave Theory correction is already done or we can revisit

Continue Reading

Saturday, June 28

Why Human Nature Works Against You as a Trader

In this article, we attempt to look at the psychological elements of trade, risk, and money management as presented in the  Successful Traders research series.
The goal of trading is to make money by forecasting future price movements.This is inherently difficult because, as human beings, we cannot tell the future.
Surely many new traders analyze data announcements, or economic reports with the goal of buying cheaply before prices may run up, or selling ‘expensive’ before prices move lower; but those traders will often soon find out that consistent profitability is considerably more difficult than ‘out-guessing’ the market.
In this article, we’re going to approach a psychological road-block that many new traders struggle with in their effort to find consistent profitability.
Defining Trading Success
Human beings naturally recognize patterns. It’s an evolutionary trait; if a man or woman were to wander out of a cave only to get eaten by a bear, others in that cave should grow cautious of leaving.
We attach emotions to results because
Continue Reading

Friday, June 27

Trade Like a Casino House

Any quick drive through Goa Casino makes it pretty clear who is making in the money – the Casinos!
Why do gamblers keep going back despite losing most of the time?  Misplaced hope, fantasies about the big win, promising themselves they will walk away when they are up and still winning, and probably the inability to calculate probabilities. These symptoms may sound familiar to new traders who have lost money in the stock market, especially when we were new to trading and had delusions of grandeur about trading their way to prosperity quickly and easily.
In gambling there are really only two sides to choose to be on, either you are a gambler or you are the house. The gamblers have the long term odds stacked against them. The more they gamble, the more the odds are that they will inevitably lose. The casino has stacked the odds on their side over the  long haul. The more the gambler keeps gambling, the more the odds shift in favor of the casino operator. The more they gamble the greater the chance the gambler will leave empty-handed.
Profitable traders operate like casinos, with the odds in their favor over the long term. They have learned to trade with historically, back-tested trading systems that put the odds on their side. Much like casino operators,
Continue Reading

Thursday, June 26

Idea,IDFC and Titan Elliot wave analysis

Titan

Titan

Titan is in impulsive wave short term target come 364 and 377 if it closes above 343.

Buy above 345 Tgt ..


Continue Reading

Wednesday, June 25

Nifty FII Data Analysis for June Expiry

FII_1
  • FII's bought 4530 contract of Index Future worth 177 cores, 17.3 K Long contract were added and 12.8 K short contracts were added by FII's.
  • Nifty is up 5% for June expiry major part of gains came in start of series, From 6 June close of 7583 and today close of 7569 nifty has just moved 14 points in 14 trading session so this series has been paradise for Option writers, As per time analysis a..

Continue Reading

Tuesday, June 24

FII FnO Data Analysis for 25 June

FII_1
  • FII's bought 16287  contract of Index Future worth 623 cores, 20.6 K Long contract were added and 4.3 K short contracts were added by FII's. FII's are approaching more from intraday perspective instead of positional view looking at OI data.
 
  • Nifty as discussed yesterday analysis completed ABC correction, did an impulsive move today, now Nifty is near its downward falling trendline resistance and 7603

Continue Reading

Larsen, Century and Kotak Bank technical analysis

Larsen and Tubro

LT
Close below 1648 stock is heading towards 1597, Close above 1686 short term target comes at 1741

Buy above 1660 Tgt


Continue Reading

Nifty completes ABC correction, FII Option data analysis


FII_1
  • FII's sold 458  contract of Index Future worth 15 cores, 11.9 K Long contract were added and 12.4 K short contracts were added So FII's went in market with hedged positions adding equally in both Longs and shorts.
  • Nifty after 10 days of consolidation broke on downside, and completed its ABC correction as shown in below chart. As per ABC pattern "It's a stop run of the first pullback after an aggressive move to the upside that signifies more potential in the direction of the larger move." so if low of ..
Continue Reading

Saturday, June 21

What separates the 10% that make money from the 90% that don’t?

Must read for every kind of trader. Enjoy your weekend!

What separates the 10% that make money from the 90% that don’t?

10,000 hours.
The key to success in any cognitively complex field is, to a large extent, a matter of practicing a specific task for a total of around 10,000 hours. 10,000 hours equates to around 4hrs a day for 10 years. For some reason most people that ‘try their hand’ at trading view it as a get rich quick scheme. That in a very short space of time, they will be able to turn 500000 into 10 Lakhs! It is precisely this mindset due to which most of traders fail !!
The greatest traders understand that trading much like being a doctor, engineer or any other focused and technical endeavor requires time to develop and hone the skill set. Now you wouldn’t see a doctor performing open heart surgery after 3 months on a surgery simulator. Why would trading as a technical undertaking require less time?
Trading success, comes from screen time and experience, you have to put the hours in!
Education, education, education.

Continue Reading

Friday, June 20

Reliance,Tech M and Crompton Greaves positional trading levels

Reliance

RILAny close below 1042 stock is heading towards 1021,1008 and 987.

Buy above 1050 Tgt

Continue Reading

Thursday, June 19

Nifty continues sideways action, FII FnO Data Analysis

FII_1
  • FII's sold 12.1 K contract of Index Future worth 460 cores, 2.7 K Long contract were added and 14.9 K short contracts were added So FII's went aggressively short in index futures.My observation is - Institutions short - Big Bears Short - Market Falls - Big Bears Cover - Pigs Short -Institutions Cover - Market Rallies for the Pigs to get slaughtered.
Nifty has been sideways mode from past 10 trading session frustrating traders, On 06 June Nifty closed at 7583 and today it closed at 7540 so just a move of 40 points from past 10 trading session on closing basis, Sentiments in these 10 days went from Extreme Bullishness to Extreme Bearish with nifty showing volatile moves within  range of 7700-7480.As shown in below chart, 7500-7520 range has been absorbing lot of selling pressure, once if it gets broken we can see a quick downfall towards 7470-7450 range.Also Gann
Continue Reading

LT,Allabhad Bank and JP Associate Elliot Wave Analysis

Larsen and Tubro

LTClose below 1652 stock is heading towards 1597, Close above 1686 short term target comes at 1741

Buy above 1677 Tgt


Continue Reading

Wednesday, June 18

Nifty gets Iraq Shocker, FII FnO Data Analysis

FII_1
  • FII's bought 5.7K contract of Index Future worth 216 cores, 9.7 K Long contract were squared off and 15.5 K short contracts were were squared off. So FII's after today's volatile move squared off both long and shorts in Index Future.
As discussed in yesterday's analysis caution is advised on longs and today we saw the voilent nature of market, in matter of 1 hour Nifty was down 132 points.  As discussed yesterday  range of 7637-7657 becomes an extremely important resistance,unable to cross the same we can see back to 7474 levels, Nifty did a high of

Continue Reading

What is the probability of ..

  • A sideways market?
  • A trending market?
  • A trend continuing;
  • A trend reversal?
  • Getting stopped out of a trade?
  • Winning a trade?
  • Breaking even?
  • Losing a trade?
All questions that need to be answered if you are to have confidence in your trading system.  For it is confidence that allows you to profit from the markets.
Ridiculous notion?  Perhaps.  But true nonetheless.
You see, despite our civilized veneer, we are still animals that react to
Continue Reading

Tuesday, June 17

FII FnO Data Analysis for 18 June

FII_1
  • FII's sold 4861 contract of Index Future worth 190 cores, 1.3 K Long contract were squared off and 3.5 K short contracts were added. So FII's are continue adding shorts in Index Future even though Nifty has risen around 100 points suggesting rise was backed by short covering only.
Nifty after doing consolidation for most of day, showed a fast rise which caught most of traders unaware and saw a fast and ferocious rally . Now the range of 7637-7657 becomes an extremely important resistance,unable to cross the same we can see back to 7474 levels and closing above
Continue Reading

BHEL,Ranbaxy and Reliance Elliot wave analysis

Ranbaxy

Ranbaxy

Buy above 481.5

Continue Reading

Monday, June 16

Nifty bounces from support ares, FII data Analysis

FII_1
  • FII's bought 2061 contract of Index Future worth 78 cores, 13 K Long contract were added  and 10.9 K short contracts were added. So FII's are adding both long and shorts in Index Future as nifty is nearing an important support level.
Nifty continued its decline, near the support area of 7474-7485, made an intraday double bottom in range of 7490 and bounced back to close above 7500 as shown in below hourly chart, 7570 is zone of resistance on upside.As per EW short term target comes in range of 7408-7410 range.Today was option writers


Continue Reading

HCL Tech, JSW Steel and Indusind Bank intraday trading stratergy

HCL Tech


Buy above 1445 Tgt 1460,1482 and 1515 SL 1438

Sell below 1420 Tgt 1401,1386 and 1364 SL 1430


JSW Steel


Buy above 1275 Tgt 1300,1314 and 1340 SL 1260

Sell below 1250 Tgt 1235,1210 and 1180 SL 1260


Indusind Bank


Buy above 543 Tgt 548,551 and 555 SL 540

Sell below 533 Tgt 528,520 and 510 SL 537

Sunday, June 15

Bank Nifty Weekly Forecast

Bank Nifty Hourly Chart


Bank Nifty Hourly chart is trading in wide band of 15700-14700. Any break below 14700 will lead to further till 14200 odd levels.

Bank Nifty Elliot Wave Analysis


As per Elliot wave Analysis correction has started and short term target comes in range of 14800-14850. Any break below this we will need to review the count.

Bank Nifty Daily Chart


As per Gann Box green line in broken and bank nifty is targeting the blue line which comes around 14700 odd levels.


Fibonacci technique


23.6 % Fibo @15101 and 38.2% @ 14705 are 2 strong support which needs to be watched in coming week.

Bank Nifty Weekly Chart


It was negative week, with the Bank Nifty down by 436 points  closing @15106 . As per Andrew Pitchfork nifty is near its median line and unable to close above it pullback will start in market.  This is what we discussed last week and Nifty made exact high at Andrew Pitchfork median line and pulled back 500 points :)

Trading Monthly charts


Monthly chart gives a target of  17000  for short term as per Fibo ratio theory

Bank Nifty Weekly Trading Levels

Bank Nifty Trend Deciding Level:15046

Bank Nifty Resistance:15176,15306,15436

Bank Nifty Support:14916,14786 and 14656

Levels mentioned are Bank Nifty Spot
Let me go by Disclaimer these are my personal views and trade taken on these observation should be traded with strict Sl
Want to see post in your Inbox,Register by adding your email id in Post in your Inbox section
Follow on Facebook during Market Hours:  https://www.facebook.com/pages/Brameshs-Tech/140117182685863

Nifty Weekly Outlook

Last Week we gave Chopad level of 7636, Nifty did 1 target on upside and 1 target on downside  after making record high @7700.  On the global front Brent Crude breached $110 and climbed near $115 mark on the back of Iraq crisis which led to rupee losing its ground and also led to jitters in the Indian as well as Global markets.   Lets analyze how to trade Nifty next week

 Nifty Hourly Chart


Nifty Hourly chart has broken its rising trendline, next week range of 7474-7478 needs to be closely watched, if held on closing basis market can see a good bounceback till 7650 odd levels else we are going to 7400 odd levels.

Nifty Elliot Wave Analysis


As per Elliot wave Analysis correction has started after making top @7700 has started its correction which might last till 7400 as per latest count as shown in above chart.

Nifty Daily Chart


As per Gann Box 7474 if not saved  fall can be deeper till 7400 odd levels. We are seeing effect of Hanging Man formation on daily charts.


 Nifty Gaps

For Nifty traders who follow gap trading there are 7 trade gaps in the range of  5300-6400
  • 5285-5303
  • 5448-5553
  • 5680-5700
  • 5780-5802
  • 6091-6108
  • 6328-6339
  • 6401-6413
  • 6493-6510
  • 6641-6643
  • 7067-7014
  • 7130-7121
  • 7276-7293
  • 7229-7239
  • 7474-7497

Fibonacci technique

Fibonacci fan


As per Gann Fans  using Nifty will be bullish only above 7700 for initail target of 7836.On Downside strong support in range of 7474-7450 breaking the same cut can deeper till 7235 odd levels.
 
23.6 % Fibo @ 7450 and 38.2% @ 7294 are 2 strong support which needs to be watched in coming week.

Nifty Weekly Chart


It was negative week, with the Nifty down by 41 points  closing @7542 . As per Andrew Pitchfork nifty is near its median line and unable to close above it pullback will start in market.  This is what we discussed last week and Nifty made exact high at Andrew Pitchfork median line and pulled back 150 points :)

Trading Monthly charts


Monthly chart gives a target of  7800  for short term as per Fibo ratio theory
 Nifty Weekly Trading Levels

Nifty Trend Deciding Level:7589

Nifty Resistance:7650,7700,7763

Nifty Support:7474,7414 and 7360

Levels mentioned are Nifty Spot
Let me go by Disclaimer these are my personal views and trade taken on these observation should be traded with strict Sl
Want to see post in your Inbox,Register by adding your email id in Post in your Inbox section
Follow on Facebook during Market Hours:  https://www.facebook.com/pages/Brameshs-Tech/140117182685863

Saturday, June 14

Ways to Reduce Trading Stress

Trading offers a wide world of opportunities to traders new and experienced alike.
It’s unfortunate, but trading profitably with any level of consistency often takes time and effort for a trader to develop their approach. Along the way are many hurdles and perhaps even more unfortunately, quite a few of those hurdles can be self-imposed.
It’s not abnormal for a trader to become ‘their own worst enemy.’ And once a trader has begun that downward spiral of self-doubt coupled with eroding confidence, winning trades may seem like they can allude for eternity.
This is trading stress, and it’s an inevitable part of the game. But for traders to find the long-term success we spoke of above, precautions must be made to ensure that this trap of self-doubt does not snare another victim.
What follows are three of the most prominent ways that traders can reduce trading stress, allowing them to focus on what matters most.
Trust the Trading Plan
Do you have a trading plan? If not, you certainly should. This is advice that is similar to: ‘Eat your vegetables,’ or ‘get 8 hours of sleep per night,’ that we all know we should follow in interests of our long-term success, but for whatever reason we might find it difficult to actually do.

Continue Reading

Nifty corrects from Elliot wave target, FII Data analysis

FII_1
  • FII's sold 14989 contract of Index Future worth 574 cores, 5348 Long contract were squared off and 9641 short contracts were added.Net Long Contract for FII's are just 21K for the current series which is lowest in 2014, so FII's are majorly going short in market.
As i was discussing in past few days, EW top of 7700 was short term top, Also Hanging Man confirmation was done yesterday and today market showed a ferocious fall the velocity of fall surprised most of market participants.  As per Elliot wave we can go till 7700-7720 but closing above 7700 looks little difficult and pullback can come from that range.


Continue Reading

Wednesday, June 11

Nifty made top @7700, Elliot wave analysis

FII_1
  • FII's bought 1.9 K contract of Index Futures worth 77 cores (4.2 K longs were added and 2.2 K shorts were added in Index Future) with net OI increasing by 6.4 K contracts.
Nifty made a new life high @7700 which was near to our Elliot wave target of 7720 as discussed in last few analysis and turned back.  As per Elliot wave we can go till 7700-7720 but closing above 7700 looks little difficult and pullback can come from that range. Any close below 7570 only will give short term reversal. Also the Bulls power indicator on daily chart has started giving negative divergences so longs need to

Continue Reading

Tuesday, June 10

Nifty forms Hanging man,FII Data Analysis

FII_1
  • FII's sold 25.1 K contract of Index Futures worth 960 cores (3.5 K longs were added and 28.7 K shorts were added in Index Future) with net OI increasing by 32.3 K contracts.FII's went aggressively short in index futures.
Nifty has formed  Hanging man bearish candlestick pattern on Daily  charts, Pattern gets activated below 7580 for targets 7474. Close above  7683 negates this  As per Elliot wave we can go till 7700-7720 but closing above 7700 looks little difficult and pullback can come from that range. Any close below 7570 only will give short term reversal. Also the Bulls power indicator
Continue Reading

Sunday, June 8

Nifty at lifehigh, Weekly forecast

Last Week we gave Chopad level of 7246, Nifty did 3 target on upside with a closing a record highs and breaking the 16 May high of 7564 also. Progress of monsoon rains .IIP and CPI which will be unveiled on 12 June.  Lets analyze how to trade Nifty before Modiji PM swearing ceremony and expiry week.

Nifty Elliot Wave Analysis

Nifty Hourly EW
This is what we discussed last week , As per EW analysis it shows short term correction is over till 7172 is not broken and bounce back till 7600  is on cards.  As per Elliot wave Theory 7629-7650 can be seen than we can see a short term pullback.

Nifty Daily Chart

nifty daily

Continue Reading

Saturday, June 7

Astrological View of Nifty/Sensex

CYCLES OF MERCURY

This is most difficult phase to deal with but these cycles are real sentiment driver.MERCURY can be seen but can"t be touched but aftershocks can be felt for long times.
Here i am discussing 6 events of MERCURY movement from Saturday i.e.7-6-2014.
1. It's is going retrograde on 7th June @17.58 hrs, it is common belief that moves that get initiated at this time continue till conjunction with sun and that will happen on 20th June.
2. It is getting com bust on 11th june for 22 days. ame given to it is SANCHHIPTA this is more bullish after conjunction with sun.
3. After conjunction with sun on 20th
Continue Reading

Thursday, June 5

FII FnO data Analysis for 06 June

FII_1
  • FII's sold 23.8 K contract of Index Futures worth 889 cores (20.8 K  longs were squared  off and 3  K shorts were added  in Index Future) with net OI decreasing by 17.7  K contracts.FII's added  shorts today also and use the rise to exit the market..
As discussed in Weekly Analysis Nifty as per Gann grid is having strong support at red line marked by Green arrow continued its journey on upside and close above red line. Next level of resistance comes at 7500-7519 range yellow line shown in Gann Box. As per EW we have strong support at 7440-7450 range which if sustained can see break

Continue Reading

Voltas,Crompton and Reliance Infra Elliot wave Analysis

Voltas

Voltas
As per Elliot wave Volatas has lot of steam left and can see level of 228-233 in short term. Poisitional longs can be take on close above 212 for short term target of 225 and 233.

BUy above 206.5 Tgt


Continue Reading

Nifty consolidates, FII FnO Data Analysis

FII_1
  • FII's sold 17.3 K contract of Index Futures worth 645 cores (7.8 K  longs were squared  off and  9.5 K shorts were added  in Index Future) with net OI increasing by 1.7  K contracts.FII's added  shorts today aggressively .
As discussed in Weekly Analysis Nifty as per Gann grid is having strong support at red line marked by Green arrow and strong resistance in red line as shown with red arrow in below chart. Nifty took exact support at 7239 green line and is moving near the green line in range of 7430-7450.  On Hourly charts Nifty is near the downward trendline resistance, also as per EW there are 2 possibility as shown

Continue Reading

Wednesday, June 4

Jesse Livermore views regarding excessive trading

1. “Money is made by sitting, not trading.”
2. “It takes time to make money.”
3. “It was never my thinking that made the big money for me, it always was sitting.”
4. “Nobody can catch all the fluctuations.”
5. “The desire for constant action irrespective of underlying conditions is responsible for many losses in Wall Street even among the professionals, who feel that they must take home some money everyday, as though they were working for regular wages.”
6. “Buy right, sit tight.”
7. “Men who can both be
Continue Reading

Tuesday, June 3

Nifty closes above 7400,FII Data Analsysis

FII_1
  • FII's sold 3.5 K contract of Index Futures worth 132 cores (7.9 K  longs were squared  off and  4.3 K shorts were squared off in Index Future) with net OI decreasing by 12.2  K contracts.FII's squared off  both long and shorts.
As discussed in Weekly Analysis Nifty as per Gann grid is having strong support at red line marked by Green arrow and strong resistance in red line as shown with red arrow in below chart. Nifty took exact support at 7239 green line and is moving near the green line in range of 7430-7450.  On Hourly charts Nifty is near the downward trendline resistance, also as per EW

Continue Reading

Common Mistakes Traders make


  • Position sizing is too big. New traders tend to trade so big that it engages their emotions to interfere with the trade and creates big losses that destroy their capital.

  • They don’t use stop losses. Traders tend to focus so much on entries and being right that they fail to have an exit plan if they are wrong and if they do they tend to not take the initial stop loss level and instead hope for a rebound.

Not researching who they are versus how their s
Continue Reading

Sunday, June 1

Bank Nifty Weekly Forecast for RBI Policy week

Last Week we gave Bank Nifty Chopad level of 15306 and Bank Nifty did all 3 target on downside rewarding traders with 387 points, We have RBI policy coming on Tuesday so big moves are on cards again. Bank Nifty will likely to see a good trending move.

Bank Nifty Hourly

Bank Nifty Hourly
Bank Nifty hourly charts is entering in supply zone, with hourly charts moving in oversold zone suggesting if range of 14700-14620 is held we can see bounce back till 15000-15200 odd levels.

Bank Nifty Hourly Elliot Wave Analysis

Bank Nifty Hourly EW

Bank Nifty on daily chart as per Elliot wave gives correction


Continue Reading

Nifty Weekly Forecast for RBI Policy week

Last Week we gave Chopad level of 7376, Nifty did 2 target on upside and 3 target on downside .Outcome of RBI's monetary policy review to dictate trend.Lets analyze how to trade Nifty before Modiji PM swearing ceremony and expiry week.

Nifty Hourly Chart

nifty hourly
Nifty Hourly charts will given a breakdown  above 7193 and now heading towards 7130 and 7067. On Upside breakout comes above 7246 for intital target of 7325 and 7376.

Nifty Elliot Wave Analysis

Nifty Hourly EW
As per EW analysis it shows short term correction is over till

Continue Reading