Sunday, March 31

Nifty Weekly Analysis

Stock Market has a woobly roller coaster ride last week opening with a gap after Cyprus Drama came to an end, giving up gains after SP Supremo,Mulayam Singh threatened to withdraw support to the ruling coalition and finally gave an expected pullback on derivative expiry,Nifty ended  up by 0.6% or 31 points  WoW basis
The first quarter of 2013 ended on quite disappointing as  Sensex and the Nifty are down around 3 per cent. The cut is, however, sharper in smaller stocks with the BSE Small-cap Index down 21 per cent and the Mid-cap Index down 13 per cent in this period.
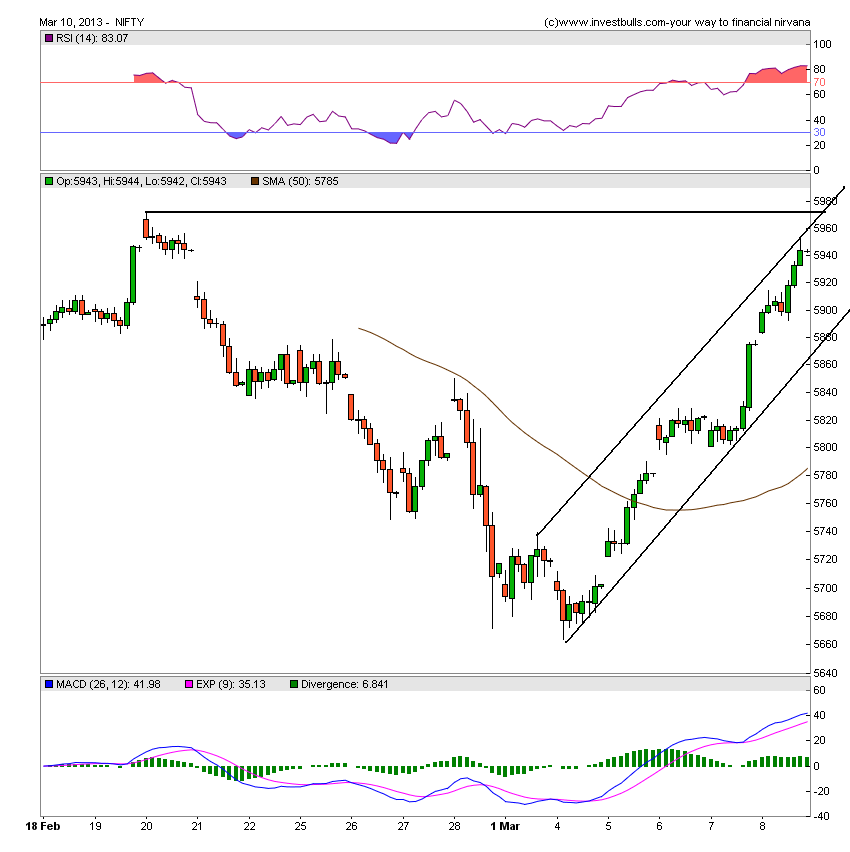
Last week we gave Trend Deciding level as 5620 Nifty made the low of 5604 turned back, achieved 1weekly targets on upside. Traders following Weekly trend deciding level should have exited shorts as discussed last week.

 Nifty Hourly Chart

nifty-mar13h1
Nifty Hourly charts as per Zig Zag Indicator..

Continue Reading

Saturday, March 30

Understanding Premium and Discount in Nifty Futures

This article will help newbie traders in understanding the difference in premium and discount in Nifty Futures and how to use them in trading.
Nifty Futures is a financial instrument in which futures contracts are done on the basis of CNX  Nifty index which is the benchmark of NSE. Nifty Futures keep moving in Premium and Discount compared to Nifty Spot price. We hear a lot of experts talking like NIFTY is available at Discount of 20 points? or Nifty Premium is increasing ? So what does they mean exactly.

What is Premium and Discount in Nifty?


Nifty Premium --If Nifty future is trading higher than nifty spot, then nifty future is trading with premium. The Highest Premium seen in Nifty was 70 points in 28 Feb 2012 expiry..

Continue Reading

Friday, March 29

Emotional Swings During Day Trading:How to Conquer them

Lets illustrate the trading emotion using an Intraday Trades,similar emotions can occur over Swing trades and positional trades ranging for weeks or even months.
9:15 AM: You watch as the market opens. You are looking for a good buy entry point into Reliance Infra@330 based on your analysis you think that Reliance Infra  has bottomed out after many days of correction stock has seen.
10:30 AM: Reliance Infra inches upward till 333  for an hour from you entry price ie.330,you are waiting for pullback near your buying point to take trade.Reliance Infra then takes a small dip. You think, “Great chance to buy on the dip!”  Originally you were planning to buy 2000 shares, 1000 for intra-day trading and 1000  for positional trading.
2000 shares? That means even if you successfully catch a Rs 5 stock price move, you only make a measly 10K? Better double that.
You buy ...

Continue Reading

Wednesday, March 27

March expiry level for Nifty

FII

Wishing Readers Very Happy , Colorful HOLI !

Volatile March Expiry is coming to an end, It raised Hope of Nifty conquering 6000 at one point of time and now we are facing danger of breaking important support of 200 DMA. Feb Expiry happened at 5693 yesterday we closed at 5641 so over 20 days of trading net to net we have moved just 40 points but sentiments have turned from excessive optimism to extreme pessimism, that the beauty of trading. Lets discuss how to trade Nifty on Expiry day.
FIIs sold 13485 Contracts of Index Future (NSE Nifty Futures and Bank Nifty Futures combined),worth 385 cores with net Open Interest increasing by 66791 contracts..

Continue Reading

Tuesday, March 26

EUR/USD short term technical analysis

The EUR/USD pair made high of 1.36 on 1 feb and has been falling mode with Cyprus Bailout and overall economic deterioration of EU countries,  However, we are reaching a fairly noisy area below, and we think the 1.28 level should continue to be a “bottom” to the market for the time being. We have analyzed the chart in 4 hour, daily and weekly time frame which suggests 1.28 should be the bottom for the time being.


EUR/USD 4 Hour Chart

eurusdh4

Fibonnaci Fans has been helpful is finding potential tops and bottom of financial instrument. Applying the same on EUR/USD pair shows EUR/USD has been respecting the


Continue Reading

Monday, March 25

Nifty near 200 DMA,FII F&O Analysis for 26 March

FII
  •  FIIs bought 7087 Contracts of Index Future (NSE Nifty Futures and Bank Nifty Futures combined),worth 198 cores with net Open Interest increasing by 117852 contracts.Take the Test  Winners and Losers in trading .As Expiry is just 2 days away Wednesday being an Holiday, FII have rollovered their positions to next series, thats the reason we are seeing big Jump in net OI.
NS closed at 5634 after  making high of 5718 and low of 5624, Nifty opened gaped Up after Cyprus clinch Bailout deal , Unable to sustain the High started consolidating in small range and ultimately came down to fill the gap,closed in red after SP news Hit the market. As per  Weekly Analysis we discussed trend deciding level as 5620, traders asked me in morning shall we take longs and my answer was emphatic NO , reason being we should always trade on levels, If we miss levels due to gap up do not jump into running bus, Have patience and wait for market to give you opportunity to enter. I know its difficult to control the urge not to take trade but you should ...

Continue Reading

Sunday, March 24

Will Bears Continue to Play Holi in March Expiry Week ?

Trading in stock markets will be volatile  in Holiday shortened week and March Derivative expiry, Political Uncertainty after DMK pullout on local front and Cyprus Bailout worries on Global front are added flavors for next week trading .Stock prices whipped on downside in volatile week and Nifty ended down 2.8% or 221 points  WoW basis. The bloodshed in mid and small-cap space  continued with stocks down between 20-45%.
Stock markets will remain shut on Wednesday and Friday on account of 'Holi' and 'Good Friday', respectively.
Last week we gave Trend Deciding level as 5880 Nifty made the high of 5864 turned back, achieved all the weekly targets on downside. Traders following Weekly trend deciding level should have minted good money.

 Nifty Hourly Chart

nifty-mar13h1

Nifty Hourly charts is forming a falling wedge pattern which is a bullish pattern and will get active once Nifty starts trading above 5693. Till it remains below this level trend ..

Continue Reading

Saturday, March 23

Triangle Trading Stratergy

In Continuation with Last week article of Trading Stocks with Symmetrical Triangle’s Chart Pattern  and How to trade Ascending Triangle Chart Pattern lets discuss another  triangle pattern
  • Descending Triangle Pattern
Descending Triangle: This pattern comprises of 2 trendline, one drawn horizontally to mark the support, second trendline is downward sloping trendline formed by joining the lower highs. This pattern is classifies as . Volumes generally diminish during the formation of the pattern and when breakdown/breakout occurs volume expansion occurs for pattern confirmation.

Descending Triangle chart pattern should contain at least 2 or more similar low not exactly equal but in proximity to form the lower horizontal trendline. To form the downward slopping trendline at least two ..

Continue Reading

Thursday, March 21

Nifty headed towards 200 DMA

FII

1. FIIs sold 4502  Contracts of Index Future (NSE Nifty Futures and Bank Nifty Futures combined),worth 130 cores with net Open Interest decreasing by 28 contracts. Top Traders Trading Secrets
2. As CNX Nifty Future was down by 51 points, with Open Interest in Index Futures decreasing by 28 so FII started Booking profits in  shorts  in past few session.
3. NS closed at 5659 after  making high of 5758 and low of 5648, Nifty continued with its downward moves,and closed below 5700 for 2 day in a row. As mentioned yesterday Hourly charts are oversold and a bounce is expected Nifty which we saw today but it was short lived, and we saw the resumption of downtrend. Nifty has closed well below its previous low of 5664 and ..

Continue Reading

Top Traders Trading Secrets

It is clear that Technical Analysis has worked in the past and continues to work for many successful traders and investors today.  But what are the common aspects that are being were used by these successful market technicians?
Unfortunately due to the extreme secrecy surrounding nearly all of these traders, the specific methods that they use are not known.  However I did uncover the following:
Common Themes
  • Mechanical trading models were used my many of the most successful.
  • They all used clearly defined systems and stuck to their rules.
  • Many of them...

Continue Reading

Wednesday, March 20

Share Trading: SBI, Sun TV and JSPL

SBIN

SBI

SBI has been following classical technical analysis support becoming resistance, as shown in above chart, rising trendline which was supporting the upmove is now acting as resistance, stock is showing pullback as soon as it approach the trendline. Stock is also near its 200 DMA @2188 and bounced back sharply. Any close below 200 DMA on weekly basis will make the long term trend in stock as bearish.

Buy above 2220 Tgt ..


Continue Reading

Tuesday, March 19

Nifty Trading Stratergy after DMK Pullout from UPA -II

FII
1. FIIs sold 28022  Contracts of Index Future (NSE Nifty Futures and Bank Nifty Futures combined),worth 806 cores with net Open Interest increasing by 13832 contracts. As discussed Nifty broke Symmetrical triangle and we saw big fall. Read more on How to trade Symmetrical Triangle pattern
2. As CNX Nifty Future was down by 99 points, with Open Interest in Index Futures increasing by 13832 so FII continued adding  shorts  in today's session.Yesterday we forewarned our readers FII are approaching Credit Policy with negative view and market rewarded traders who followed the advise. :) . Traders who are going extremly short in market thinking government w..

Continue Reading

Monday, March 18

FII F&O Analysis before RBI March 2013 Policy

FII

1. FIIs sold 23908  Contracts of Index Future (NSE Nifty Futures and Bank Nifty Futures combined),worth 699 cores with net Open Interest increasing by 16992 contracts. Financial Markets around the world, were rocked by Cyprus bailout, Read more about What is Cyprus Bailout Crisis
2. As CNX Nifty Future was down by 45 points, with Open Interest in Index Futures increasing by 16992 so FII have created fresh  shorts  in today's session at lower levels.So they are entering the RBI policy with negative view and any good news can trigger an upside rally.
3. NS closed at 5835 after  making high ..

Continue Reading

Cyprus Bailout:Another Greece in making

Cyprus is an island country in the Eastern Mediterranean Sea. Cyprus is the third largest island in the Mediterranean Sea, and a member state of the European Union. With talk of another bailout to Cyprus has caused jitters in world financial market when most of them were trading at new highs. Let me explain why this small EU member has caused all world markets to tumble.
1. What happened in Cyprus last week?

It all started from 2008 Financial crisis, Greece Economy collapsed, EU gave 3 Bailouts to Greece . The prices for the bailouts were high: austerity policies that didn’t work. The result everywhere is that national income has fallen steeply, while the countries fall further into debt.Cyprus banks got into trouble from their exposure to neighboring Greece. FM of Euro nation,IMF and ECB came with a plan to bailout Cyprus but this time the bailout conditions were little harsh:
In exchange for..

Continue Reading

Sunday, March 17

Index Weekly Outlook: Nifty awaits RBI cues

The RBI’s Fourth quarter monetary policy meet scheduled for the 19 March will also be keenly awaited by investors and traders. As CPI climbed 10.9 per cent in February from a year earlier, compared with 10.8 per cent in January, it has raised concerns about the extent of rate cut by the central bank on 19 March.Stock prices whipped in both direction in volatile week and Nifty ended down 1.2% or 73 points  WoW basis.
Last week we gave Trend Deciding level as 5971 Nifty made the high of 5971 turned back, achieved all the weekly targets on downside. Traders following Weekly trend deciding level should have minted good money.

 Nifty Hourly Chart

Nifty Hourly
Nifty Hourly charts are trading ...

Continue Reading

Saturday, March 16

Analyzing Ascending Triangle Chart Patterns

In Continuation with Last week article of Trading Stocks with Symmetrical Triangle’s Chart Pattern lets discuss another  triangle pattern
  • Ascending Triangle Pattern

Ascending Triangle: This pattern comprises of 2 trendline, one drawn horizontally to mark the resistance, second trendline connects increasing slope of higher low. It is generally a continuation pattern formed during consolidation after an uptrend. Volumes generally diminishes during the formation of the pattern
Ascending Triangle chart pattern should contain at least 2 similar highs not exactly equal but in proximity to form the upper horizontal trendline. To form the lower ascending trendline at least two higher lows are required. We would set an entry order above the resistance line and Sell order below the slope of the higher lows.
Note: If a more recent ...

Continue Reading

Friday, March 15

Ed Seykota’s Magic Trading System

Edward Arthur Seykota is a commodities trader who pioneered Systems trading by using early punched card computers to test ideas on trading the markets. He famously said:
" Systems don’t need to be changed. The trick is for a trader to develop a system with which he is compatible."
Below are the points he has stressed on to make consistent profits.
1: Do not stress about whipsaws – one good trend pays for them all.
A whipsaw is when you enter a stock, but get stopped out quickly.  In a period of whipsaws, this may happen many times.  This can be frustrating to a trader or investor, and it may cause them to change their system.  But the fact is that one good trend will pay for all of these whipsaws, and if you change your system you lose the benefit of that!
2: When you Catch a Trend, ride it to the end.
Your system must be..

Continue Reading

SBI,BHEL and Bajaj Auto Technical View

SBIN

SBI
SBI made the high of 2236 on budget day which was exact its rising trendline resistance as shown in above chart.SBI made a low of 2051 and than having a slow and steady rise.Stock is approaching a crucial resistance region of 2263-2284 which needs to be watched closely .

Buy above 2262 Tgt..


Continue Reading

Thursday, March 14

Nifty Daily Technical, FII F&O Analysis for 15 March

FII
Filtering of Noise is one of the most important characteristic of trader as discussed in Successful Traders Secret Mantrtoday was the test, Rumors of Scam in Banking Sector, panic selling in Stock market formation of panic bottom and a rally.
1. FIIs bought 1445 Contracts of Index Future (NSE Nifty Futures and Bank Nifty Futures combined),worth 45 cores with net Open Interest decreasing by 3895 contracts. Mastering Fear in trading
2. As CNX Nifty Future was up by 72 points, with Open Interest in Index Futures decreasing by 13351 so FII have covered  shorts  in today's session at lower levels.FII also did lot of day trading today looking at derivative data,
3. NS closed at 5909 after  making high of 5920 and low of 5791,Nifty has formed Bullish engulfing pattern with rise in volume after a decline of the last couple of sessions ..

Continue Reading

Trading calls:ICICI,PFC and Zee Limited

ICICI Bank

ICICI BankICICI Bank broke its medium term trendline on Budget day formed DOJI candlestick for 2 days and rallied with rest of market in 1 week of march,formed resistance at 50 DMA and gave a pullback.Stock is trading near to its trendline support and tommrow session will be litmus test for the stock.

Sell below 1082 Tgt..


Continue Reading

Wednesday, March 13

FII F&O Analysis for 14 March trade

FII
1. FIIs sold 7579 Contracts of Index Future (NSE Nifty Futures and Bank Nifty Futures combined),worth 223 cores with net Open Interest decreasing by 13351 contracts. Mastering Fear in trading
2. As CNX Nifty Future was down by 69  points, with Open Interest in Index Futures decreasing by 13351 so FII have covered  shorts  in today's session at lower levels.
3. NS closed at 5851 after  making high of 5894 and low of 5842, Nifty opened gap down and was unable to fill the gap, and continued with its downfall throughout the session . Nifty has reacted sharply from Weekly Trend Deciding Level of 5971 yesterday and also closed below 50 SMA@5943 for 5 time in a row from Feb 8. So a combination of both Weekly trend deciding level and ..

Continue Reading

Stock for Intraday Trading:IRB,Jsw Steel and Ranbaxy

IRB

IRB
IRB share value is approaching its long term falling trendline resistance, Stock has formed a base around 112 odd levels . Stoch is approaching 80.6 and unable to cross the 80.6 Stoch indicator can form a double top and lead to pullback in stock till 115. IRB share is also approaching cluster of long term moving averages 125-127 which will be difficult to cross in a single attempt so traders can use the range of 125-127 if and when it comes to book profits on their holding.

Sell below 119 Tgt..


Continue Reading

Tuesday, March 12

FII Option Data analysis

FII
1. FIIs sold 17370 Contracts of Index Future (NSE Nifty Futures and Bank Nifty Futures combined),worth 517 cores with net Open Interest decreasing by 11650 contracts. Painful Truths About Trading
2. As CNX Nifty Future was down by 20  points, with Open Interest in Index Futures increasing by 11650 so FII have initiated shorts  in today's session.
3. NS closed at 5914 after  making high of 5952 and low of 5893 after IIP data and Inflation data both came more than expected the market, So good IIP data got nullified by Bad Inflation data :) . Nifty has reacted sharply from Weekly Trend Deciding Level of 5971 yesterday and also closed below 50 SMA@5943 for 5 time in a row from Feb 8. As discussed yesterday in option analysis..


Continue Reading

Monday, March 11

Nifty forecast for 12 March

FII
1. FIIs sold 2239 Contracts of Index Future (NSE Nifty Futures and Bank Nifty Futures combined),worth 68 cores with net Open Interest increasing by 10567 contracts. Successful Traders Secret Mantra
2. As CNX Nifty Future was down by 10  points, with Open Interest in Index Futures increasing by 10567 so FII have booked profit in longs in today's session.
3. NS closed at 5942 after  making high of 5871 and low of 5932. Nifty has reacted sharply from Weekly Trend Deciding Level of 5971 and also closed below 50 SMA@5944. Traders if see Nifty chart closely from ..

Continue Reading

Day Trading Stocks : Tata Motors,Maruti and JSPL

JSPL

JSPLJSPL share value has been on a firm downtrend trading firmly in downtrending channel, formed a bullish engulfing pattern on Fridays session. Continuation of the rally will come if its able to close above 370.

Buy above 371...


Continue Reading

Sunday, March 10

Nifty forecast for next week 11 Mar - 15 Mar

Bears after ruling the Dalal Street from past 5 weeks got a knock out punch from Bulls as they were able to rally 4% . Dow Jones at Life time high, Europe at 2008 High and Japan above 12000 propelled the risk on rally and nifty also rallied with its peers. Week ahead promises to be  more fast-paced action as share market will await the factory output data on Tuesday and inflation on Thursday, which are expected to set expectations ahead of the central bank's monetary policy decision on March 19. Moody’s prophesy that the worst may be over for the Indian economy and that it could grow at 7 per cent from 2014 also helped improve the sentiment on the street.
Last week we gave Trend Deciding level as 5765 Nifty as soon as Nifty moved above it achieved all the weekly targets. Traders following Weekly trend deciding level should have minted good money and should have avoided taking shorts.

 Nifty Hourly Chart

Nifty Hourly
Hourly charts are trading in a perfect up trending channel after making low ..

Continue Reading

Saturday, March 9

Technical analysis Tutorial

A Chart Pattern is a distinct pattern formed on stocks/commodity chart which help in identifying the future price movements.
Chart Patterns are broadly classified in two types:
Reversal Patten: This pattern signals the previous trend will reverse upon completion of this pattern. Eg double top, Double bottom, island reversal, rounding bottom, Descending triangle
Continuation Pattern: This pattern signals that trend will continue upon completion of this pattern Eg. Ascending Triangle, Symmetrical triangle, Cup with handle, Flag pattern.

Triangle Chart pattern:
When price of stock/commodity stays in a trading range and with passage of time the trading range becomes smaller ie. Contraction of price and convergence of trendline leads to formation of triangle pattern.  Triangle pattern are generally identified by consolidation in the trend followed by breakout pattern in direction of continuing trend.
Lets take an Example of..


Continue Reading

Thursday, March 7

Bulls Ruling Dalal Street FII Analysis for 08 March trade

FII
1. FIIs bought 13834  Contracts of Index Future (NSE Nifty Futures and Bank Nifty Futures combined),worth 410 cores with net Open Interest decreasing by 8960 contracts. Share pledging How it works?
2. As CNX Nifty Future was up by 48  points, with Open Interest in Index Futures decreasing by 8960 so FII have booked profit in longs in today's session. Nifty rallied from 5664 to 5878 214 points in 4 trading sessions and we have been in Buy from 5737 levels as per trend deciding level :)
3. NS closed at 5863 after  making high...

Continue Reading

Stock Trading Chart: Rcom,United Sprits and Infosys

Infosys

InfosysInfosys share has been on a roll after its Q3 results, stock is one of the biggest gainer in Nifty in past 2 months,gaining 27% till date. Stock is approaching a crucial resistance zone of 2980-2994, where the share has shown pullback past 3 times. Negative divergence are clearly visible in daily charts so probability of showing a pullback from the resistance range of 2980-2994. Positional trades can book profit in this range.

Sell below 2956 Tgt..


Continue Reading

Wednesday, March 6

Nifty Trading Strategy for 7 Mar based on FII F&O analysis

FII
1. FIIs bought 6613 Contracts of Index Future (NSE Nifty Futures and Bank Nifty Futures combined),worth 191 cores with net Open Interest increasing by 12937 contracts. Share pledging How it works?
2. As CNX Nifty Future was up by 39 points, with Open Interest in Index Futures increasing by 12937  so FII have created longs in today's session after shorting the whole feb series today they have gone long on positional basis.
3. NS closed at 5819 after  making high of 5829 and low of 5795. Nifty opened today with a upside  gap of 32 points, but was unable to sustain above the gap area gave gains in afternoon session but still we have a

Continue Reading

What is pledging of shares?

Share Pledge by Promoters term have been making headline on Blue channel and news paper after the atrocious and devastating fall we saw in Mid caps in last week of February. It began with Sell off in couple of mid caps shares in last week of feb spread as a contagion to many other stocks eroding 40-80% of market capital of companies in matter of 2 weeks.

Stock market investor and traders if they refresh theie memories similar fall had happened in Jul 2012 and Nov 2011.Brokers tracking the midcap space and officials at some non-banking finance companies say the contagion has been caused by group pledging of shares by companies who were unable to raise funds against these shares, individually. 

So question arise in Why promoters pledge shares of their companies?

Promoters pledge share to raise funds for numerous reasons ranging from personal needs to business ..

Continue Reading

Tuesday, March 5

FII F&O Data Analysis for 6 March trade in NF and BN Future

FII
1. FIIs bought 6185 Contracts of Index Future (NSE Nifty Futures and Bank Nifty Futures combined),worth 175 cores with net Open Interest decreasing by 9317 contracts. How to Build Trading Confidence
2. As CNX Nifty Future was up by86  points,posted Biggest Single day Gains since NOV. 29 2012  with Open Interest in Index Futures decreasing by9317  so FII have done short covering today, also did intraday trades. Still no net longs are added by FII. Yesterday we clealry mentioned Shorts are getting covered at lower levels by FII and today we had an stupendous rally :)
3. NS closed at 5784 after  making high..

Continue Reading

Monday, March 4

FII F&O Data Analysis for 5 March trade in NF and BN Future

FII
1. FIIs bought 13985 Contracts of Index Future (NSE Nifty Futures and Bank Nifty Futures combined),worth 399 cores with net Open Interest increasing by 34143 contracts. Techniques to Increase Trading Profits
2. As CNX Nifty Future was down by 13  points after recovering more than 30 points from the low of 5678  with Open Interest in Index Futures increasing by34143 so FII have done short covering today, no fresh shorts are added by them.
3. NS closed at 5699 after  making high of 5712 and low of 5664. Nifty opened today with a downside gap of around 15points, declined further and made a new swing low of around 5663 levels.It recovered nicely..

Continue Reading

Stock Trading Recommendations:Bank Nifty,IDFC and JP Associate

Bank Nifty

Bank Nifty FiboBank Nifty made high of 12954, the day RBI reduced CRR rate and have been on declining mode from that day. Indian Current account deficit at record high, GDP lowest in almost 8 years and bad loans growing at rapid pace suggesting financials are in good health and same is reflected in benchmark Bank Nifty.
Bank Nifty has taken support of 50% retracement of recent rise from 9807-12954. Bull market bounce from 50% retracement, so this could make a good trade from short term.

Buy above 11550 Tgt..


Continue Reading

FII F&O Data Analysis for 4 March

FII
1. FIIs sold 9117 Contracts of Index Future (NSE Nifty Futures and Bank Nifty Futures combined),worth 263 cores with net Open Interest increasing by 4955 contracts. Techniques to Increase Trading Profits
2. As CNX Nifty Future was up by .55  points with Open Interest in Index Futures increasing by 4955 so FII again intitated shorts  in Nifty Futures and Bank Nifty Future.Premium of NF has come down to 10 points from 50 points yesterday.
3. NS closed at 5720 after  making high of 5738 and low of 5682. Nifty has formed bottom of 5672 on Budget day which is 80% retracement from 5527-6112, Holding the same bounce back till 5765 should be ..

Continue Reading

Sunday, March 3

Nifty Weekly Outlook: March 2013

Bears kept ruling the Dalal Street for 5 week in row as Sensex and Nifty closed at 2013 low, with Nifty closing with cut of 2.2%. Union Budget got a Thumbs down from the market as it did not meet the market expectation. The sharp plunge in mid- and small-cap stocks on rumours of pledged shares of promoters being off-loaded, was the other sidelight of the week gone by. The BSE Mid-cap index lost 3 per cent, while the small-cap index lost over 5 per cent. Derivative expiry on Thursday turned out to be Highest turnover of 4.02 lakhs.We will be again following the cues from global market as domestic events are over. Services sector data and ECB, BoE meetings in focus from global perceptive.
Last week we gave Trend Deciding level as 5882 Nifty makes the high of 5878 and achieved all the weekly targets. Traders following Weekly trend deciding level should have minted good money.
Below is the chart of how Nifty performs post budget and picture from last few years have been if Nifty corrects before budget it continues the trend from next 30 days also. So pre budget we corrected almost 5% so March has a negative outlook going by previous year data...

Continue Reading

Friday, March 1

Successful Day Traders Secrets

When a trader takes a trade,  they experience wide range of emotions from panic in case trade is nearing stop loss to Greed when trade is nearing  target thinking "Aur upar jayega abhi Hold karo"
This attitude of trade lead to looses. Yesterday ie. Budget Day many traders did not book profit when Nifty/stock were rising , thinking FM will deliver a growth oriented budget and were forced to move out of trade when margin calls were triggered.  Self-discipline and emotional control are keys to success, which none of us are born with.
One of the top three things that will determine the success of a trader is the trader’s psychology, the weakest part of any trading plan is the trader and stress can knock a trader out of trading faster than anything else. You have to trade like it is a business. Realize that it is highly probable that half of your trades will be losers the money will be made by the half that are winners being bigger than the half that are losers.
 Losing money is never ..

Continue Reading