Monday, August 31

Black September for Stock Market ?

Black September for Stock Market ?

For Stocks, September May Be the Cruelest Month

September is fewer than three weeks away. Feeling nervous? Maybe you
should be. For investors, the period between Labor Day and Halloween
is proving an annual fright show. And no one knows why.

It was, of course, in September last year that Lehman collapsed and
everything fell apart. But then it was also September-October 2002
that the last bear market plunged to its lows.

The 1998 financial crisis? It began late August, and rolled on for two months.

The famous crash of 1987 came in October. But most people have
forgotten that the market actually started sliding downhill in late
August.

That's almost exactly what happened in 1929 too. The big crash came in
October, but the market peaked just after Labor Day. Prices began
falling through September, then tumbled further still.

The worst month of the Depression? September, 1931, when the Dow fell
about 30 percent.

It was also in September, 2000, that the bear market really got going.

The 9/11 crisis, of course, came in September. That was hardly caused
by investors. But what is forgotten is that the stock market was
already looking wobbly. In the two weeks before the terrorist attacks,
the Standard & Poor's 500-stock index fell 7 percent.

The great panic of 1907? October. The great crash of 1873? September.

Yikes.

So is there really a September, or a Halloween, effect?

Since 1926, investors have lost nearly one percent on average during
September, according to market data tracked by finance professor
Kenneth French at Dartmouth's Tuck School of Business. It's the only
month with a negative average return.. For each of the other 11
months, investors gained nearly one percent on average.

Other research takes the idea of an autumn dip even further. Georgia
Tech doctoral student Hyung-Suk Choi studied the so-called "September
effect" as part of his recent Ph.D. thesis. He looked at data for 18
developed stock markets around the world spanning up to 200 years, and
found that in 15 of those markets, September brought red ink for
investors.

Fund manager Sven Bouman and finance professor Ben Jacobsen concluded
that investors in most world markets have historically fared poorly
from May through October each year. They made their money between
November and April.

Hence the old British investors' saying, "sell in May and go away,
don't come back till St Leger Day." (But since St. Leger Day is in the
middle of September, even that date may be premature.)

Some of the September or Halloween effect is caused by a few really
bad years. But that's not the whole story. To reduce the influence of
outliers I looked instead at the median result since 1926 instead of
the statistical mean. The performance gap between September and the
other months shrank from 2 percent to 1.4 percent. That's smaller, but
it's still a difference. The median September saw losses of just 0.07
percent. But the median month for the rest of the year gained 1.37
percent.

As for the causes of a possible September effect, most are stumped.

"There haven't been any good academic stories to explain it," admits
Michael Cooper, finance professor at the University of Utah's David
Eccles School of Business. "One credible explanation is just luck."

It's been suggested that mutual funds drive down the market by selling
their losing stocks before their October 31 year end. Or that third
quarter profit warnings come in early September, raising fears about
full-year results. Or that these autumn crashes used to be related to
the harvest, as Midwestern banks withdrew capital from New York.

(Still another theory cites seasonal affective disorder. Investors
simply get more risk-averse, and more prone to sell, as the days get
shorter. That's the case argued by York University finance professor
Mark Kamstra and others.

So what, if anything, should you do?

In practical terms, maybe not that much. For most people, even a
performance difference of one or two percentage points isn't going to
cover the transaction costs of selling before the end of August and
re-entering the market a month later. And stock market patterns aren't
ironclad. The market may even jump in September, as it did in 2006 and
2007.

Perhaps the best you can do is brace for turmoil.

Sunday, August 30

Nifty Trading ideas for Week Starting 31 Aug

IFCI SL 53 tgt 60 65 BRoken after long period of consolidation and Vols are increasing significantly

DLF SL 397 tgt 444 Trend line breakout 20 WMA above 50 WMA


Larsen sl 1540 BUy above 1630-50 tgt 1760 1790


Voltas sl 148 buy range 155-65 tgt 180

WElspun Gujrat above 250


Keep trailing your SL.

Nifty Weekly Technical View


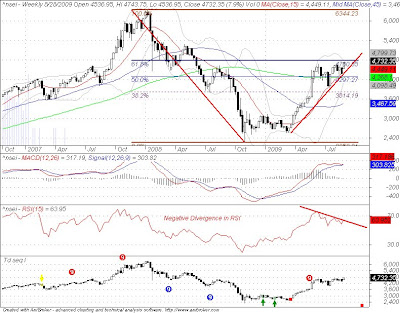
Nifty daily Charts are showing Bullish Inverted HnS with neckline placed around 43730 levels.If that is crossed with vols we cane see 4780 levels.4800 being 61.8% of fall from 6.2 to 2200 so will defiantly will be a resistance.


61.8% retacement metioned in charts above will prove a significant Resistance.I will like to bring in to the notice of the reader than it can be a false breakout making everyone bullish on streets and than tanking big time.Market has its own way of operating.

Weekly Resistance:4766 4801 4859

Weekly Support:4674 4614 4589

Below 4589 if broken with vols short heavily

Thursday, August 27

Bharat Forge Mometum is back??


One of the trading Set up which i like to trade multiple tops and bottom.Bharat Forge qualifies that.Today moved up with good volumes Now it qualifies for a buy if it trades above 238 for a tgt of 245 and 254.

HCL tech Buy above 322 tgt 330 345 Support is at 296

Nifty forming Flag and Pole Pattern


Negative Divergence is observed in RSI.Stochastic in oversold zone.Support at 4633 4579,4500.Actually forming Flag and Pole pattern and if 4485 breaks we can easily see 4325-50 levels.

Monday, August 24

Trading Ideas for the coming Week

HI All,

Seasons Greetings to all.

Due to work pressure m unable to post nifty Weekly charts
NIfty Weekly
Resistance 4650 4740
Support 4500 4340 4130

Trading Ideas

Astra Microwave:SL 72.70 tgt 83 88

Jupiter Bio:SL 72.50 Tgt 83 88 High vols on Friday

India Bulls real estate tgt 277 290 sl 242

LIC Housing above 650 tgt 660 675

GMDC Short term View on Readers Request


GMDC 89-90 will provide good support between 89-90 levesl where we have 61.8% Retracement and 5 EMA also Placed OS watch out this levels for extremly short term view.

Real mometum will start shwoing in stock once it start trading above 95 levels It can quickly move to 97 101 108 levels 105 Levels some resistance can some

At lower levels 84 and 77 should provide good support.

Thursday, August 20

JP Associate on do or die condition


Extremely Short term pick Took a very good support at 203-205 levels

Buy only above 212 for a tgt of 217 219 sl 204

Tuesday, August 18

Reliance EOD Charts


Hi All,

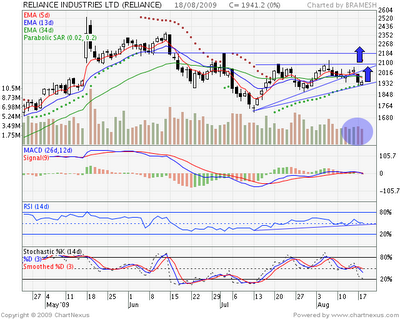
Reliance took trend line support at 1924 and had a very dull session today,But volumes were OK so this indicates an distribution pattern.now if market needs to go up RIL will always play a crucial role.Looking at the charts once can take long above 1958 gor a target of 1975 1994. 2000-2010 will be a good resistance zone above that 2030 2061 and 2100 are my targets in coming Expiry,

Comments are welcome

Sunday, August 16

Trading Ideas for the coming Week


Cairn India locked in a rectangular pattern and we can see a breakout trade if it starts trading above 252-53 with a tgt of 256 262

Petronet LNG buy 72.50 sl 69 tgt 75 77 80

Short Renuka Sugar with sl of 190 tgt 175 170 165 158

Essar Oil above 141 143 146 (Intra call)

Reliance above 2045 tgt 2064 2096 2121

Nifty Weekly Technical View


HI All,

Wishing all of the Blog readers a Very Happy Independence Day.

Nifty Daily Charts are Displayed above:-
A Clear Inverse Head and Shoulder is developing in the Daily Charts with neckline placed the at 4700 Levels.So be bullish only above 4700 Levels only till 4650-4680 try to book out profits on longs.

Drought can not be ignored by Bulls as the India Still Being agrain economy will definatley come under pressure.So Stocks from Automotive and FMGC sectors can be hammed down.


Now coming to levels which need to be watched.
Weekly Pivot is at 4550

Nifty is Week Below 4510 and can see levels of 4490 4460 4409

Nifty is strong above 4619 for a tgt of 4645 4679 Very strong if closed above 4700 and can see 4780 Levels

Thursday, August 13

Nifty holds 4385 on closing basis

Nifty at last held the crucial support of 4385 on closing basis.This will be treated as a good trend reversal sign as per my understanding.Adding fuel to the fire is dow shooting up 160+ point as i write this post.

Nifty now will face resistance around 4501 4544 4562 and 4600.

Few Trading Ideas


Formed a bullish hammer on EOD charts Facing resistance around 34 EMA buy of 687 for a tgt of 700 719

Suzlon as i am bullish on this stock from past few trading sessions Real run up will start once it start moving up above its 5 EMA which is at 87 for a tgt of 90 and 94

RIL also will move above 2012 for a tgt of 2034 2069 2096

Wednesday, August 12

Reliance Revisited


RIL which dragged Nifty Down today formed a Gravestone Doji (not perfectly)which can be trend reversal signal.

Stuck in a range of 1971 to 2096 Today closed at lower end of Range.I would advocate that next rise in Nifty will be lead By RIL 2040 CE has seen good accumulation by smart money.

by Keeping a sl of 1945 go long for a tgt of 2039 2078 2106

Tuesday, August 11

Mercator Line TA on Reader's Request


MLL is in quiet a strong Downtrend.But the good things for Bulls in this counter was the fall accompanied by a very small Volume.

Now strong is near a good support between 50-52 Range If the Stock is able to hold this support on a closing basis than stock can negate its downtrend and can move forth for a tgt of 56 59 66.

Monday, August 10

Sell Gail if 309 is Broken and sustained


Gail is forming a Pennant Kind of pattern with the Bootom line at 309-311 If this range get broken and sustained than we are insight of 303 295.

Longs only above 323 for a tgt of 327 330 336

Punj Lloyd Technically Speasking


Support are coming at 209 201 and 188.An important point to note is that it closed above its 50 SMA today. quiet oversold on EOD charts and will give a very good bounce if 209 is not broken on closing basis
Resistances are at 230 243 251

Sunday, August 9

Trading Ideas for Week Starting 09 aug


Bank Of India is showing Symmetrical Triangle formation with support around 319,and resistance coming around 339

Trading Idea can be to buy around 319-321 Range and keep a SL of 317 if it bounces than hold long with a tgt of 324 334 339 and if Sl gets triggered go short with a tgt of 309 300 296

SPARC buy for a tgt of 82 SL 70

Reliance Industries Buy above 2018 Tgt 2027 2035 2044 2064 2091 sl 1971

Suzlon Buy above 87 tgt 89.9 93.8 96

Saturday, August 8

Nifty Weekly Technical Views


Nifty Weekly and Daily Charts are presented above:
1. Nifty was unable to cross the Fibonacci 61.8% Resistance of 4793 in the present up move.
2. Bearish divergence were highlighted in previous week analysis Click to View
3.On EOD charts the present uptrend in extremely short term is broken and rallies till 4585-4600 should be used to short with strict sl as above 4600 we are again back in the uptrend.
4.The present correction can move upto 4380-4420 levels but looking at the way dow has rallied i have a strong felling we will move at least 2% on Monday and the rise will be led by RELIANCE.

Weekly levels which need to be watched:

Resistance:4560 4600 4653
Support:4432 4386 4293

Labels:

Friday, August 7

Trading Ideas


Gravestone Doji formed in RIL

Implication:Candelstick denotes a Trend reversal

5 EMA of RIL was 2025 if 2025 got broken today than levels to be watched out are 2027 2001 1988 1977 1966

Upside only above 2096 watch this Chart


Welspun Gujrat Sell if 220 is broeken and Sustained tgt 215 210

Wednesday, August 5

Reliance Industry the Poster Boy revisted


RIL has shown some phenomenal run in past few trading sessions from the bear bashing on bad results posted to a levels back to almsot 2.1K

So whats next

Chart we can easily see a double top formation around 2096 Levels and i have highlighted the Negative divergence in RSI also

SO for Bull run to continue 2096 should be taken out and sustained for a tgt of 2116 2148 and 2175 in extremly short run or else go short with a tgt of 2044 2011 1991 if 2096 is not taken out.

Five Reasons the Market Could Crash This Fall

An interesting Read and fodder for thought.


BY: GRAHAM SUMMERS
With all this blather about “green shoots” and economic “recovery” and new “bull market,” I thought I’d inject a little reality into the collective financial dialogue. The following are ALL true, all valid, and all horrifying…

Enjoy.

1) High Frequency Trading Programs account for 70% of market volume

High Frequency Trading Programs (HFTP) collect a ¼ of a penny rebate for every transaction they make. They’re not interested in making a gains from a trade, just collecting the rebate.

Let’s say an institutional investor has put in an order to buy 15,000 shares of XYZ company between $10.00 and $10.07. The institution’s buy program is designed to make this order without pushing up the stock price, so it buys the shares in chunks of 100 or so (often it also advertises to the index how many shares are left in the order).

First it buys 100 shares at $10.00. That order clears, so the program buys another 200 shares at $10.01. That clears, so the program buys another 500 shares at $10.03. At this point an HFTP will have recognized that an institutional investor is putting in a large staggered order.

The HFTP then begins front-running the institutional investor. So the HFTP puts in an order for 100 shares at $10.04. The broker who was selling shares to the institutional investor would obviously rather sell at a higher price (even if it’s just a penny). So the broker sells his shares to the HFTP at $10.04. The HFTP then turns around and sells its shares to the institutional investor for $10.04 (which was the institution’s next price anyway).

In this way, the trading program makes ½ a penny (one ¼ for buying from the broker and another ¼ for selling to the institution) AND makes the institutional trader pay a penny more on the shares.

And this kind of nonsense now comprises 70% OF ALL MARKET TRANSACTIONS. Put another way, the market is now no longer moving based on REAL orders, it’s moving based on a bunch of HFTPs gaming each other and REAL orders to earn fractions of a penny.

Currently, roughly five billion shares trade per day. Take away HFTP’s transactions (70%) and you’ve got daily volume of 1.5 billion. That’s roughly the same amount of transactions that occur during Christmas (see the HUGE drop in late December), a time when almost every institution and investor is on vacation.

HFTPs were introduced under the auspices of providing liquidity. But the liquidity they provide isn’t REAL. It’s largely microsecond trades between computer programs, not REAL buy/sell orders from someone who has any interest in owning stocks.

In fact, HFTPs are not REQUIRED to trade. They’re entirely “for profit” enterprises. And the profits are obscene: $21 billion spread out amongst the 100 or so firms who engage in this (Goldman Sachs (GS) is the undisputed king controlling an estimated 21% of all High Frequency Trading).

So IF the market collapses (as it well could when the summer ends and institutional participation returns to the market in full force). HFTPs can simply stop trading, evaporating 70% of the market’s trading volume overnight. Indeed, one could very easily consider HFTPs to be the ULTIMATE market prop as you will soon see.

TAKE AWAY 70% of MARKET VOLUME AND YOU HAVE FINANCIAL ARMAGEDDON.

2) Even counting HFTP volume, market volume has contracted the most since 1989

Indeed, volume hasn’t contracted like this since the summer of 1989. For those of you who aren’t history buffs, the S&P 500’s performance in 1989 offers some clues as what to expect this coming fall. In 1989, the S&P 500 staged a huge rally in March, followed by an even stronger rally in July. Throughout this time, volume dried up to a small trickle.

What followed wasn’t pretty.

Anytime stocks explode higher on next to no volume and crap fundamentals you run the risk of a real collapse. I am officially going on record now and stating that IF the S&P 500 hits 1,000, we will see a full-blown Crash like last year.

3) This Latest Market Rally is a Short-Squeeze and Nothing More

To date, the stock market is up 48% since its March lows. This is truly incredible when you consider the underlying economic picture: normally when the market rallies 40%+ from a bear market low, the economy is already nine months into recovery mode. Indeed, assuming the market is trading based on earnings, the S&P 500 is currently discounting earnings growth of 40-50% for 2010. The odds of that happening are about one in one million.

A closer examination of this rally reveals the degree to which “junk” has triumphed over value. Since July 10th:

  • The 50 smallest stocks have outperformed the largest 50 stocks by 7.5%.
  • The 50 most shorted stocks have beaten the 50 least shorted stocks by 8.8%.

Why is this?

Because this rally has largely been a short squeeze.

Consider that the short interest has plunged 72% in the last two months. Those industries that should be falling the most right now due to the world’s economic contraction (energy, materials, etc.) have seen the largest drop in short interest: Energy -90%, Materials -94%, Financials -86%.

In simple terms, this rally was the MOTHER of all short squeezes. The fact that it occurred on next to no volume and crummy fundamentals sets the stage for a VERY ugly correction.

4) 13 Million Americans Exhaust Unemployment by 12/09

A lot of the bull-tards in the media have been going wild that unemployment claims are falling. It strikes me as surprising that this would be true given the fact that virtually every company that posted the alleged “awesome” earnings in 2Q09 did so by laying off thousands of employees:

  • Yahoo! (YHOO) will cut 675 jobs.
  • Verizon (VZ) just laid off 9,000 employees.
  • Motorola (MOT) plans to lay off 7,000 folks this year.
  • Shell (RDS.A) has laid off 150 management positions (20% of management).
  • Microsoft (MSFT) plans to lay off 5,000 people this year.

So unemployment claims are falling, that means people are finding jobs right? Wrong. It means that people are exhausting their unemployment benefits. When you consider that there are 30 million people on food stamps in the US (out of the 200 million that are of working age: 15-64) it’s clear REAL unemployment must be closer to 16%.

And they’re slowly running out of their government lifelines.

The three million people who lost their jobs in the second half of 2008 will exhaust their benefits by October 2009. When you add in dependents, this means that around 10 million folks will have no income and virtually no savings come Halloween.

Throw in the other four million who lost their jobs in the first half of 2009 and you’ve got 13 million people (counting families) who will be essentially destitute by year-end.

How does this affect the stock market?

The US consumer is 70% of our GDP. People without jobs don’t spend money. People who are having to work part-time instead of full-time (another nine million) spend less money than full time employees. And people who are forced to work shorter work weeks (current average is 33, an ALL TIME LOW), have less money to spend.

Wall Street makes a big deal about earnings (earnings estimates, earnings forecast, etc), but when it comes to economic growth, sales are the more critical metric. Companies can increase profits by reducing costs temporarily, but unless actual top lines increase, there is NO growth to be seen. No revenue growth means no hiring, which means no uptick in employment, which means greater housing and credit card defaults, greater Federal welfare (unemployment, food stamps, etc), etc.

So how will corporate profits perform as more and more consumers become part-time, unemployed, or destitute? Well, so far profits have been awful. And that’s BEFORE we start seeing millions of Americans losing their unemployment benefits.

click to enlarge

With the S&P rallying on these already crap results… what do you think will happen when reality sets in during 3Q09?

5) The $1 QUADRILLION Derivatives Time Bomb

Few commentators care to mention that the total notional value of derivatives in the financial system is over $1.0 QUADRILLION (that’s 1,000 TRILLIONS).

US Commercial banks alone own an unbelievable $202 trillion in derivatives. The top five of them hold 96% of this.

By the way, the chart is in TRILLIONS of dollars:

As you can see, Goldman Sachs alone has $39 trillion in derivatives outstanding. That’s an amount equal to more than three times total US GDP. Amazing, but nothing compared to JP Morgan (JPM), which has a whopping $80 TRILLION in derivatives on its balance sheet.

Bear in mind, these are “notional” values of derivatives, not the amount of money “at risk” here. However, if even 1% of the $1 Quadrillion is actually at risk, you’re talking about $10 trillion in “at risk.”

What are the odds that Wall Street, when allowed to trade without any regulation, oversight, or audits, put a lot of money at risk? I mean… Wall Street’s track record regarding financial instruments that were ACTUALLY analyzed and rated by credit ratings agencies has so far been stellar.

After all, mortgage backed securities, credit default swaps, collateralized debt obligations… those vehicles all turned out great what with the ratings agencies, banks risk management systems, and various other oversight committees reviewing them.

I’m sure that derivatives which have absolutely NO oversight, no auditing, no regulation, will ALL be fine. There’s NO WAY that the very same financial institutions that used 30-to-1 leverage or more on regulated balance sheet investments would put $50+ trillion “at risk” (only 5% of the $1 quadrillion notional) when they were trading derivatives.

If Wall Street did put $50 trillion at risk… and 10% of that money goes bad (quite a low estimate given defaults on regulated securities) that means $5 trillion in losses: an amount equal to HALF of the total US stock market.

This of course assumes that Wall Street only put 5% of its notional value of derivatives at risk… and only 10% of the derivatives “at risk” go bad.

Do you think those assumptions are a bit… low?

Tuesday, August 4

Trading Ideas

Hope u all njoyed Hindalco Few more Trading Ideas Updated.


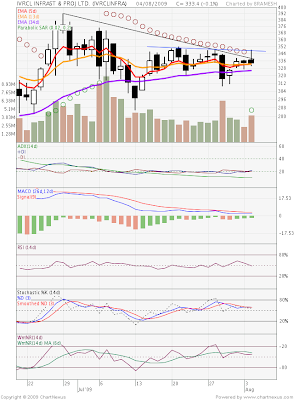
IVRCL Buy above 348 if sustained


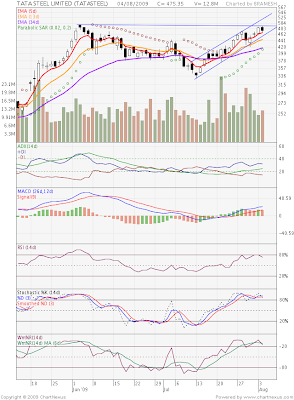
TATA Steel Buy above 492-94 Zone is taken out Stock is moving towards 532

And if unable to cross go short 460 442

Sunday, August 2

Stocks Specific Calls for week starting 03-Aug

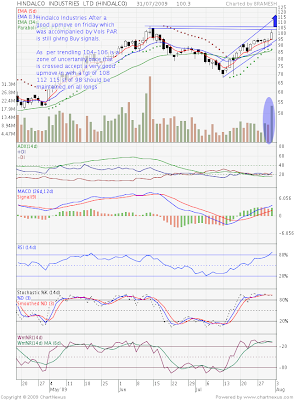
Hindalco Industries After a good upmove on friday which was accompanied by Vols PAR is still giving Buy signals.

As per trend Lines 104-106 is a zone of uncertainty once that is crossed with vols accept a very good upmove in with a tgt of 108 112 115 sl of 98 should be maintained on all longs.

Should be kept on Radar a Good Buy at dips


Ashok Leyland has formed a rounded bottom and has formed multiple tops around 38 Levels

Move on Friday was accompanied by good vols

Now if the stock crosses 38 Level with vols go long with a tgt of 42 and 44


Polaris Multiple tops breakout 20 WMA crossing 50 WMA tgt 150 sl 115
ONGC Pennant Breakout on Weekly charts 20 WMA crossing 50 WMA tgt 1325 sl 1100
SBI buy in range 1790-1825 sl 1760 tgt 1920 1960

Saturday, August 1

Nifty Weekly Analysis an Inverse H&S formation

Happy Friendship Day to all the Visitors of the Blog


Nifty Weekly and Daily Charts are presented.

Deduction from Daily Charts:

We are moving firmly in a Channel and a near term resistance are 4669.75 and 4693.

Once that is crossed we can easily sail through 4700 4724 4778 .

Supports are emerging at 4575 4546 4468.

Concerns on Daily and Weekly Charts are The negative divergence observed in RSI.

Weekly Charts
:Shows an Inverse H&S formation with a neckline placed at 4700 Levels.An irony which was observed that Sensex which has hit a new 52 Week High has closed above neckline resistance but Nifty is still lagging.

Now lets take a Bullish Scenario in which Inverse H&S formation works

If 4700 is crossed what Levels we may see in coming weeks are 4730 4824 and 4979

and suppose we fall due to bad Global cues we may see 4575 4546 4468.

Results seasons has also come to an end and but the spoilsport were metals and real estate guys which have posted deep gashes. One point to ponder on in rise on profit is on back of Cost cutting measures take by company not on margin improvements.


Regards,
Bramesh