Thursday, April 30

Nifty Technical View Range Predicting

HI All

Hope you Enjoyed the Nifty Long call @3410 and Reliance Long Call Initiated at 1762 Today.

I will tell you one trade set up which will help you all In predicting the Nifty Movement in near term.

Take Long in Nifty when 13 Ema > 30 EMA > 55 EMA

After Yesterday Fall Nifty 13 EMA was at 3351and low was 3352 So actually we should have taken Long.IF you see on Right Hand side I have Nifty TRIN Column where i daily update the EMA's Value

After Today's Close 13 EMA stands at 3369 So if Nifty See another Fall we should have close watch at 3369 Levels.

Now at present we have Resistance at 3520 which is high we were unable to cross So Eagle eyes needs to be kept on this level before initiating any trade.

Hope this article will be useful to you.

Regards,

Bramesh

Tuesday, April 28

Nirmal Kotecha Case – a laudable move by SEBI

The Securities and Exchange Board of India (SEBI) by its order dated 23rd April 09, passed against Nirmal Kotecha, in the matter of Pyramid Saimira, is a laudable one, but this indicates a finger on many such stocks, in which, pure speculative game is being played by the operators. This is with a view to trap the retail investors ultimately.

Infact, this game is being played more in the recently listed stocks, where not much financial datas of the company are available and even the public float of these companies get easily cornered by the operators in nexus with the promoters and management. We have seen huge momentum having played in the stocks like Aishwarya Tele, Edserve Soft, First Winner, Niraj Cement, NuTek India, Usher Agro and Resurgere Mines, where, prices in the secondary market were pulled up artificially and now finally all the stocks are held by the retail investors, at a very high price.

Even now, some of the stocks are still ruling artificially and at very unrealistic and high prices which are Alkali Metals, Anu’s Lab, Austral Coke, Allied Digital and Vishal Info. But what we generally see that even retail investors cum traders, get lured by this kind of rise and volatility and tempt them to indulge in it, with this confidence, that, they are smart enough to make quick bucks and get out of it. But it results in those traders getting converted into investors, due to fall in prices.

If we read the detailed order of SEBI in case of Pyramid Saimira, total modus operandi has been elaborated in it. If one can also track the volume in above stocks, mentioned by us, it can easily be established and found that many such fronts and conduits are working for operators like Nirmal Kotecha.But this kind of investigations and analysis is possible either for SEBI or for stock exchanges.

Infact, there are about 10-12 operators active in the markets on the lines of Nirmal Kotecha, who extends their expertise and operational support, by taking the assistance of Flls, mutual funds, brokers and benami accounts to trade to trade on their behalf to rig up the price.

But all the plays of those operators can get sabotaged, if, a trader remains away from such stocks.

BY S.P.Tulsian

NIfty Intra Day Charts Head and Shoulder Formation


Nifty has formed H&S PAttern on Intra day charts which signals a trend reversals on cards

Nifty now is forming support at NIFTY SPOT TAKING SUPPORT AROUND 200 DAYS DMA 3370-3380

BREAK BELOW TRG 3300-3270-2975-2915
BREAK BELOW 3300 NIFTY SHOULD BECOME WEAK

Monday, April 27

Nifty Bullish Flag Pattern Breakout


Bullish Flag Pattern Breakout
A bull flag is a sharp, strong volume rally on a positive fundamental development, several days of sideways to lower price action on much weaker volume followed by a second, sharp rally to new highs on strong volume.

Target can be 3-4% from 3470 sl should be at 3395-3400

Sunday, April 26

Nifty and Stock Specific Trading Ideas 27-29 April

Dear All,

Hope all of you had a rocking week and made good profits in BOth options and Equity Calls

While my personal favorite being option in which we again made 100% in 3400 CE.

We are holding a High Risk Call 3400 PE @30 Lets see how it spans out.

Coming to next week which is again truncated and Expiry is on Wednesday.

Nifty now faces resistance at 3511 if it crosses and sustains above that we may see 3600 in expiry but as per my calculation we may expire between 3331 to 3541


Stock Specific


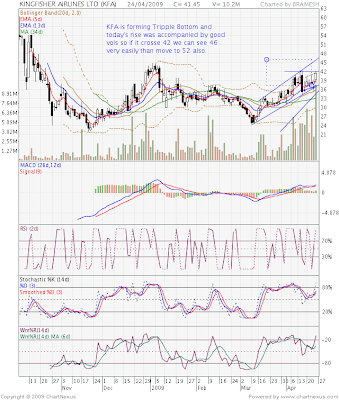
Kingfisher Airlines above 42 has a target of 45 and 50

Videcoon Industries above 122 for a tgt of 133 nad 145 sl 112

MRPL above 51 for 57 and 62 Sl 47

SAIL for a tgt of 120-125 Sl 105

HDIL had formed double top @ 156 if it is unable to cross 156 Short it else if 156 crossed and sustained take long for a target of 162,170.

Infosys Technologies buy 1467.5 for a target 1500

For live intra day calls Join
http://tagg.in/taggtivity.php?q=38745

For your stock specific Queries Mail @ bhandaribrahmesh@gmail.com


Regards,

Bramesh

Friday, April 24

Updates on Stock and Nifty Call given in April

Technical Analysis of KingFisher Airlines


KFA is forming Tripple Top and today's rise was accompanied by good vols so if it crosses 42 we can see 46 very easily than move to 52 also.

Thursday, April 23

How much should you invest?

Must Read for Traders and Investors

Most finance textbooks emphasise the virtues of diversification: by diversifying your investments you can minimise your losses. But a high degree of diversification also ensures only average investment performance. The maestros of the investment world have all made their money by playing the game differently. Unlike the small investor who makes small and frequent bets, the maestros make infrequent but big bets. It is not as if they love risk. They make these big bets only when they perceive that the downside risk to them is minuscule and the upside potential very high.


Take a couple of examples. After the salad oil crisis hit American Express in 1963, Warren Buffett calculated that this was only a temporary crisis, and that so long as customers' faith in American Express's traveller cheques remained intact, the company would recover from this setback. He wagered $7 million, effectively 40 per cent of his fund on this single investment.


Similarly, in 1992, George Soros calculated that the British pound would be devalued even though UK's Chancellor of the Exchequer kept insisting till the very last that a devaluation was not in the offing. Soros bet $10 billion on this single wager through leveraging, (Quantum Fund's worth then was $7 billion). Though we might think that Soros acted like a risk junkie, in reality this master investor calculated that in case things didn't pan out the way he thought they would, his loss wouldn't exceed 4 per cent.


How much to bet


What the above two examples underline is the need to invest only when the stock market offers us very high odds of winning. For any investment that we are considering, we also need to think about the probability of different outcomes. And finally, investors must know the optimum amount of their total funds that they should bet on a particular investment. The Kelly formula offers the answer to the last question.


The Kelly f ormula can be defined as = edge/odds. For simple bets with two outcomes, such as tossing a coin, the formula is: f = (bp - q)/b where, f is the fraction of your funds you should bet; b is the net odds received on a bet (odds are quoted as "b to 1"); p is the probability of winning; and q is the probability of losing.


Imagine that someone offers you a bet wherein you will be paid Rs 4 if the coin shows head; and Re 1 if the coin shows tail. Here b=4; p=0.5; and q=0.5. f = (4*0.5 - 0.5)/4 = 1.5/4 = 0.375.


According to Kelly formula, the maximum you should bet is 37.5 per cent of your funds.


Now, investments are not dual but multiple outcome bets, with each outcome having a different probability. Suppose you are analysing a stock and you believe that your returns from it would be as follows: 80 per cent probability that the stock will rise 200 per cent; 15 per cent that it will rise 100 per cent; and 5 per cent that you will lose all the m oney (-100 per cent return). Instead of doing the calculations yourself, visit this web page: www.cisiova.com/betsizing.asp which has a calculator for the Kelly formula. In the first column, fill the outcome name (in our example, write: one, two, and three); in the second column, fill expected returns (here, 200, 100 and -100); in the third column fill the probability (here, 80, 15, and 5). Click on the calculate button. The answer we get is 92.2 per cent. This is the maximum percentage of your funds you should bet on this investment.


Most investors tend to be conservative, deploying a smaller percentage of funds than the formula suggests, and rightly so. After all, investors can never predict the probability of various outcomes with complete certainty. Hence, some degree of conservatism is advisable. Above all, what using the Kelly formula does is reinforce the habit of thinking probabilistically about our investments.

Wednesday, April 22

Bear Market Rallies Are Like Drug Addicts

That said, I've seen this movie before and I know how it ends.


If the rally continues (BIG IF), the next leg is going to be characterized by mind-blowing moves higher from some of the ugliest stocks on earth.

You have to look at a bear market rally like you look at a drug addict.

The first phase is just intoxication, like the feeling one gets after a few beers down at the Regal Beagle Bar & Grill. The market equivalent of this is a move higher in the blue chips and mega-cap stocks. We saw that develop in mid-march.

Next, the rally extends to the rest of the large caps, some mid caps and the growth indexes in general get their upswing. This is like the addict switching from beers to tequila and then smoking a little weed out behind the bar with his cousin and the busboy.

Once the large and mid cap stocks have had their moves, the junkie looks to the smaller cap names and even some of the more distressed S&P stocks that sat out the beginning of the rally. The euphoria kicks in here, as this would be right around the time he ducks into the mens room to crush up a few pain pills and snort them off the sink.

Now, the addict is flying high, and the search begins for lower quality, damaged stocks and tertiary names in a given sector, as he thinks these could play catch up to their better-managed and bigger brethren companies. At this point, he is sitting in his car outside his ex-girlfriend's house doing lines of cocaine off of CD cases.

The final stage of this junkie odyssey is right around now. This is where the manager or trader who was either too much in cash or worse, had too many shorts on, reaches for the real garbage to catch up. We saw the beginning of that this past week as Krispy Kreme (KKD), a company that has managed never to do anything right since its IPO 8 years ago, ran up 50% in one day on the fantastic news that their creditors would not, in fact, push them into bankruptcy. When you start to see the bankruptcy candidates and 90 cent stocks putting on 40 and 50% moves, you are looking at the equivalent of a drug addict sucking the nitrous gas out of a whipped cream canister, so desperate for that final high that he'll pretty much try anything at the end of the night.

Unfortunately, I fear that this is the stage we are arriving at, if this rally continues in the coming week. I hope I'm wrong, but there were way to many monster moves from lousy companies at the tail-end of last week. I watched this go on after every major bear market rally in the early part of this decade and I learned how bad the hangover could be firsthand back then, too.

One need only take a gander at the top percentage advancer's list during the next up day to determine whether or not I'm right. If the junk dominates the leader boards, you'll know we're closer to the hangover than the beginning of the buzz.

Tuesday, April 21

Grasim Industries Technical Charts

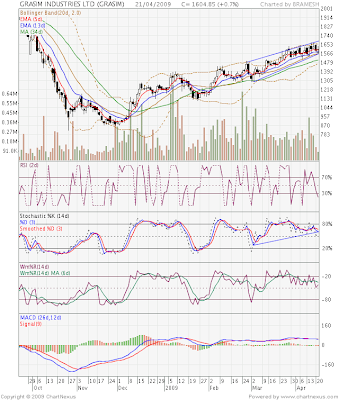
Grasim Industries is trading in a small range from 1575 to 1675 in past few trading Session

Today it took support at 20 EMA and closed at 1604,Now it faces resistance at 1675.

So longs can be intiated with a tgt of 1675 with a sl of 1559 and if 1675 breaks it opens gate for the target of 1700 -1725

RSI2 is near overbought zone and Win RD is showing positive divergence.

Monday, April 20

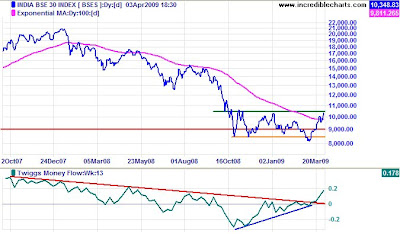
Sensex Technical View using Twigg's Money Flow Indicator

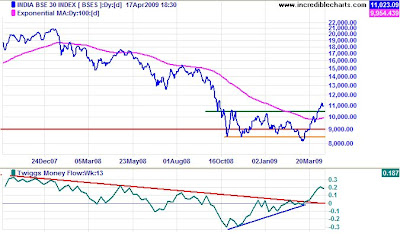
The Sensex is retracing to test the new support level at 10500. Respect would confirm the reversal to a primary up-trend. Twiggs Money Flow (13-Week) bullish divergence offers further confirmation. The target for the breakout is 12500, calculated as 10500 + [ 10500 - 8500 ].

How to survive stock market bubble

An Interesting Article

By Brian Perry, Investopedia

In almost all instances, the root cause of a financial crisis is an asset bubble. But how does this bubble form, what finally causes it to pop and how can investors profit before it goes bust?

In order for a market to attain the excessive valuations necessary to prompt a crisis, a prolonged period of price appreciation combined with a large number of new entrants to the market is usually necessary. Read on to learn more.

Crisis in the making
The combination of price appreciation and an increase in new entrants to the market are defining characteristics of market bubbles. Investors should remember that many bubbles are based on attractive fundamentals, which explain why money flows into the market in the first place.

However, at some point, so much money flows into the market that valuations exceed even those justified by attractive fundamentals, signaling the end of a bull market and the beginning of a bubble. Bubbles are fueled by the collective greed of investors. When this greed turns to fear, a crisis can ensue as investors rush to sell their holdings in a declining market.

Common factors
In addition to the emotions of greed and fear, a review of the historical record shows that several common factors have been present at the onset of many financial crises. These factors include:

  • asset/liability mismatch
  • excessive leverage
  • excessive risk
  • currency mismatches

Frequently, more than one of the factors are present, and each of the factors can be heightened by another.

Asset/liability mismatch
An asset/liability mismatch occurs when there is a wide differential margin between the duration of a financial institution's loans and investments and its deposits or other funding sources. This factor was present in the 2007 collapse of Bear Stearns and the 2008 Lehman Brothers bankruptcy.

Both of these firms were highly dependent on short-term financing to conduct their operations. However, the assets that they held proved to be illiquid during the credit crisis, and were therefore effectively long-term in nature. This mismatch between the firms' assets and liabilities directly contributed to their bankruptcies.

Excessive leverage
Asset/liability mismatches are present to some degree in many financial institutions. In fact, one of the main purposes of financial intermediaries is to facilitate the transformation of short-term deposits into long-term loans. Under normal circumstances, this mismatch is manageable.

However, the problem becomes particularly acute when financial institutions employ excessive leverage. Excessive leverage exacerbated the asset/liability mismatch at Bear Stearns and Lehman Brothers and was also the main cause of the Long-Term Capital Management collapse in 1998.

Excessive risk
Another common cause of financial crises is that financial institutions take on excessive risk. This may occur intentionally, like when savings and loan institutions invested in risky real estate deals in the 1980s, eventually prompting the S&L crisis. Excessive risk can also occur unintentionally; investment banks and other financial institutions that purchased mortgage-backed securities prior to the 2008 credit crisis believed they were safe.

In another famous example, Long-Term Capital Management believed that its portfolio held little risk because each of its trades was individually offset by other trades. However, when extraordinarily high volatility hit the financial markets in 1998, all of LTCM's trades began to move in the same direction, prompting massive losses and fears of a systemic financial collapse.

Currency mismatch
Governments sometimes find themselves in trouble when their borrowing is denominated in a foreign currency. This is a common factor in emerging market debt crises, including the Latin American debt crisis of the 1980s, the Asian financial crisis of 1997 and the Argentinian debt default of 2002.

In all these instances, the governments had issued bonds or received loans denominated in foreign currencies. When the countries' currencies began to decline in value, the cost of repaying the foreign currency debt increased dramatically, prompting a crisis.

Economic impact of financial crises
Financial crises do not always have a severe economic impact. The US stock market crash in October, 1987 was the worst in US history to date, but the market soon recovered and there was minimal economic impact.

On the other hand, some financial crises have caused severe economic damage. The Japanese equity and real estate market declines that began in 1990 ushered in a deflationary period in Japan, and sub-trend growth that persisted for nearly two decades.

Although the recovery from the 1997 Asian financial crisis occurred fairly rapidly, the short-term damage was extremely severe. In the year following the crisis, GDP growth contracted by 13.1 per cent�in Indonesia, 7.3 per cent�in Malaysia and 10.5 per cent�in Thailand.

Unfortunately, there is no obvious reason as to why some economies suffer following a financial crisis while others do not. However, there is a large body of research on how to mitigate the effects of a financial crisis and it seems very likely that by minimizing the severity of the crisis, policy makers can improve the chances that the broader economy will not be severely damaged.

Preventing and mitigating financial crises
The key to minimizing the effects of a financial crisis seems to rest upon two principles, as explained in the book Lombard Street (2005) by Walter Bagehot.

Providing the financial system with adequate liquidity: During the 2008 credit crisis, the Federal Reserve and other global central banks repeatedly lowered interest rates and provided extraordinary levels of liquidity to the financial system.

Establishing confidence in the safety of the banking system: This prevents consumers from rushing to the bank to withdraw their deposits. Confidence can be secured by providing government guarantees on bank deposits; in the US this guarantee comes in the form of the FDIC insurance program.

Reacting to a crisis
One of the deciding factors in the success of policy actions is the speed with which they occur. It seems that the earlier policy makers recognize and react to a crisis, the more effective their actions become. If adequate liquidity is quickly provided, and confidence in the banking system is maintained, the effects of a crisis can be mitigated.

How can investors navigate financial crises?
There's a joke that most traders are familiar with: "If you can keep your head when all around you are losing theirs, you haven't been paying enough attention." This gallows humor generates a few chuckles, but the investing principle that it parodies holds the key to success during times of a market crisis.

It is difficult to avoid buying into a market bubble. No one likes to watch from the sidelines while everyone around them makes money, but history has shown again and again that market bubbles always burst. Some investors may have impeccable timing and be able to ride the bull to its apex before selling at just the right moment. However, these fortunate souls are rare, and their unique talent is probably not a successful recipe for the average investor.

While the growth of bubbles usually occurs over time, crashes can occur with stunning rapidity. During these times, the sense of fear in the marketplace can become so palpable that is easy to understand why some crashes have been labeled "panics." Sometimes, there may be a solid fundamental reason to sell into a panic.

If short-term trading is not part of one's strategy, and the holdings that are declining in value constitute only one part of a well-diversified portfolio, most investors would be wise to withstand the urge to sell.

The bottom line
Because markets are the sum of the emotions of millions of investors, they periodically experience large swings of optimism and pessimism. If an investor is able to ignore the madness of the crowd and focus on investment goals, those goals are very likely to be met. Having and sticking to a plan over time is the key to investment success. This is true during normal market cycles as well as during bubbles and financial panics.
Sunday, April 19

Hindalco Industries Chart with Technical View


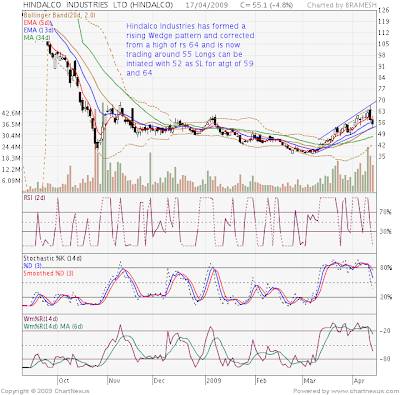
Hindalco Industries has formed a rising Wedge pattern and corrected from a high of rs 64 and is now trading around 55 Longs can be intiated with 52 as SL for atgt of 59 and 64

Nifty and Stock Specific Trading Ideas

Dear All,

Hope all of you had a rocking week.

Coming to the current week which at last is not an truncated week,Market has posted phenomenal 6 weeks Gains in arow which i have never seen in my trading carer. So What's NEXT !!

India VIX is at 50.12 so be cautious on longs you are holding as Higher VIX there is a good propabality of correction in near term.

Technically Speaking for Nifty Weekly Chart Click on Below Link.

http://3.bp.blogspot.com/_iAG8XurigTA/SemNHKEXkrI/AAAAAAAAASk/7_aoJVOsozU/s1600-h/Nifty+April+20-24.bmp


Due to call Writing at 3500 and 3600 Levels we will see an Stiff resistance at 3520 Levels and support is at 3312 3250 and 3150 Levels.So what i would suggest is to buy at declines not to jump in bandwagon now and repent later.

Stock Specific

Reliance as posted previously Reliance faced a resistance around 1825-1835 and it fell and closed at 1716 Now support is at 1685 and 1655 and 1607 So be a buyer on dips and short at 1811 Levels.

Hindalco Taken support around 55 Keep a sl of 52 and take long for a target of 59 and 63

ROLTA sell around 98 sl 110 tgt 80-75

Ganesh Housing Stock closed above 20 DMA CAn see a tgt of 65 and 72 SL 49

Core Project keep a Sl of 85 and intiate longs for a tgt of rs 150 in 1-2 months frame.

Unitech above 56.25 for a tgt of 60 63 and 65 Support at 45 and 38 Buy on declines or if crossed and sustained above 56

Regards,
Bramesh

09985711341

Thursday, April 16

Maruti Technical Charts


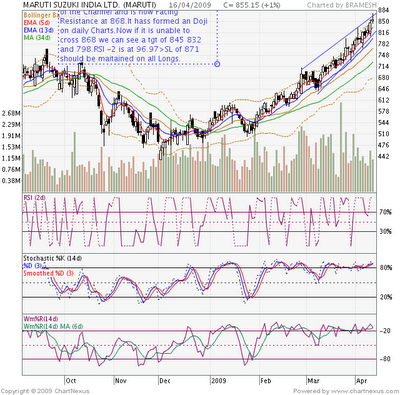
Maruti is now trading at the upper band of the Channel and is now Facing Resistance at 868.It has formed an Doji on daily Charts.Now if it is unable to cross 868 we can see a tgt of 845 832 and 798.RSI -2 is at 96.97.SL of 871 should be maintained on all Longs.


ONGC does 846 Given 2 days before.Click on the Link to visit that

http://brameshtechanalysis.blogspot.com/2009/04/is-it-falling-wedge-in-ongc.html


Nifty Trading Ideas for this week also gave good return


http://brameshtechanalysis.blogspot.com/2009/04/nifty-and-stock-specific-trading-ideas.html

Wednesday, April 15

SATYAM ACQUISITION BY TECH MAHINDRA – ROAD AHEAD

Tech Mahindra has been successful in bidding for Satyam Computers, wherein, it will be acquiring 31% stake at Rs. 58 per share, in Satyam, by way of preferential allotment followed by open offer for additional 20% at the same rate, from the shareholders of Satyam.

Open offer is likely to be for 19.54 crore shares of Satyam, while its present paid up equity stands at 67.40 crore shares. Of this, ADR holding is at 13.07 crore shares while L&T is holding 8.08 crore shares. Since shares held by L&T are not eligible to participate in the open offer, as it has a lock in of 6 months, there is expectation that even ADR holders may not see active participation. Due to this, Acceptance Ratio is likely to be 50%, viz. one share is likely to get accepted out of two shares tendered.

Coming on to the strategy for the Satyam shareholders, the performance of the company is bound to increase in FY 10 with Tech Mahindra taking charge and share price, which is now ruling at Rs. 48 will rise in due course of time. But, benefits of this rise would be seen more in the share price of Tech Mahindra, as, in its consolidated results, 51% of Satyam’s PAT would get added to its bottomline, while 100% of Satyam turnover in its topline. So it is advised to move to Tech Mahindra from Satyam, now, without participating in the open offer.

If we presume that for FY 10, Satyam is likely to have a topline of Rs.7,000 crores with PAT of Rs.700 crores, it would translate into an EPS of Rs.7. As Satyam will have outstanding number of shares at 97.67 crore, after preferential allotment. In this situation, if you expect share price of Satyam to rule at Rs.42, post open offer, this translates into PE multiple of 6 times.

Tech Mahindra had posted a topline of Rs.3,407 crores for nine months ending 31-12-08 while its PAT is placed at Rs.784 crores resulting in an EPS of Rs.64.FY 09 EPS is Likely to be close to Rs.75 and share price, ruling at Rs.372 is translating into a PE of close to 5 times.

Tech Mahindra would be requiring close to Rs.2,900 crores for acquiring 51% stake in Satyam. This is expected to get mobilized with internal accruals of Rs.900 crores and debt of Rs.2,000 crores. Tech Mahindra at present is a debt free company with present net worth of Rs.1,800 crores. The company has an annual cash generation of close to Rs.700 crores, after paying dividend on the equity shares. Hence an Additional interest burden of Rs.300 crores would get charged to the consolidated results of Tech Mahindra. Since it will be entitled for 51% PAT of Satyam, which is likely to be Rs.350 crores, the acquisition will be EPS accretive for Tech Mahindra. Once, this debt of Rs.2,000 crores would get paid in next two years, Consolidated PAT would sharply jump.

Conversely, if Satyam is not able to post an EPS of Rs.7, share price may not be able to hold Rs.40 levels. In that case, we may also not see any rise in share price of Tech Mahindra and it may remain Static at Rs.370 levels. So even in this case, it will be better for Satyam shareholders to move to Tech Mahindra right now without waiting to participate in the open Offer.


By SP Tulsian

Tuesday, April 14

Is it Falling Wedge in ONGC?


Falling Wedge Trend Reversal Observed in ONGC.Support @ 5 EMA which is 868 after which 846 on cards.

Sensex Technical View from Twiggs Money Flow Indicator


The Sensex broke through resistance at 10500, signaling reversal to a primary up-trend. Twiggs Money Flow (13-Week) confirms with a strong bullish divergence. The target is 12500, calculated as 10500 + [ 10500 - 8500 ]. First, expect retracement to test the new support level.

Sensex Rally of 2009

Our market is witnessing a very strong rally from the beginning of March 2009 and the Prime mover of Index of Sensex and Nifty is by the PosterBoy of Indian stocks “Reliance Industries Limited”. When RIL makes a strong move, the sentiment of our market completely changes to its direction of movement.

Today many of us have moved there perception from extreme Pessimism to overwhelmed euphemism.But i will tell you markets have mind of there own.

I am taking a contrarian view of the market, and I am quite sure this market should top out soon between 3850 – 4000. It is not new to stock market that bear market Rallies are very sharp and powerful and convert many of the even seasoned traders into bullishness.

Technically speaking, bear markets tend to retrace by 38.2% of the previous year range, and going by the parallels of the empirical evidence, Nifty should retrace to around 3800 ( which is 38.2% retracement of last year range of 6336 and 2228 which are high and low of the year 2008) But the crowd of technical analysts will be gunning for this figure of 3800 and looking for reversal to happen but market may take them for a ride and make further upmove by 150 to 200 points, may be closer to 4000 level or may be it can reverse from 200 points before ie. from 3600 Levels and convert everyone into complete bullishness for still higher targets.

According to me, no Bull market is born without a huge consolidation after a severe bear market and this is not going to be the new one to defy this historical evidence. Every bull market needs a strong base formation of a very long period may be around couple of years and this time also it will happen with certainty.

The very first impediment of this rally to advance further would be around 3500 level and if it is conquered without much of an effort on closing basis for a few continuous days, then it will further move to 3950 to 4000 level and eventually topout. One needs to be very careful in plunging into market at this hour in investing their hard earned money in market.

Reliance Industries was the prime mover of Index in the last one month and stock has moved from Rs.1140 to Rs 1775 in a month’s time. The stock is very closer to 38.2% of retracement of last year range and it comes to around Rs.1825 level. There are few index stocks which has to catch-up with this rally to make this logical retracement level and till such time, majority of other index stocks participate, RIL will not topout and sharply come down. To support the other stocks making its logical retracement, RIL can stay float for some more time above 1825 to 2000 and will finally give-up for bears to takeover the market.

Adding fuel to fire for this rally is, prominent Institution Elliot wave International views about Indian stock market entering into 15 years bull market for SENSEX target of 100000 is flashed in many of the websites and many traders who by their bullish nature jumping into this market buying the view of EWI.

The quality of stocks which are movingup this market excepting Reliance, doesn’t even give the credence of bull market and it’s a clear sign of Bear market rally. If we look at the past history of Bull markets, in the first leg Midcap and small cap will not participate to a greater extent and will not generate cent percent returns in a very short time period of less than a month’s time as it is doing now. The first wave of bull market is always ignored by traders and small investors due to lack of conviction and, we always find only two sets of people in the market fully invested during that move for a long term creation of wealth viz, smart /seasoned investors and Institutions. Today we see all types of market participants in this rally. All these prove, this rally could not be a beginning of Bull market.

Readers of my view, please understand that I am giving my view of market getting toppedout soon is based on technicals by drawing the evidence from the past history of market behavior. As market is overheated now, the trigger for this fall could be the announcement of Parliament Election results.

And when we look at Nifty chart, it moves in a cycle of making intermittent high and low once in two and half months. This cycle of uptrend also comes to end by May 2009 second week and in all probabilities I think, elections results could trigger a topout of this rally.


Monday, April 13

Reliance Industrial Infrastructure - What is game?

Reliance Industrial Infrastructure Ltd (RIIL) share price has been moving up and had risen from Rs. 318 on 2nd April to Rs. 820 on 9th April. In three trading sessions, a rise of 158%. On Thursday, 9th April, it had a turnover of 105 lakh shares on NSE and 50 lakh shares on BSE which has surpassed the present paid up equity of the company, which is at 151 lakh shares. Obviously, delivery percentage has been very low at just 3%.


So why this sudden jump in the share price? Though Reliance Industries has denied merger of RIIL with itself, it has a different angle.


If one may recall, share price of RIIL in August 07 was ruling at Rs. 500 per share which rose to Rs. 3,200, one way, by October 07. At that time, people close to the management, as also, ex- promoter of the company, being Anand Jain, along with Reliance Industries Ltd (RIL), being the present promoters, sold over 20 lakh shares of the company. If we presume that all the shares were got sold at an average of Rs. 3,000 per share and now having bought them back , at an average of Rs 500 per share, this gave them a gain of close to Rs. 500 crores. Remember, RIL sold about 4.62% stake of Reliance Petroleum, during that time and made a gain of Rs. 4,733 crores .RIL became promoter of RIIL in March 06, though RIL has been holding 46% stake in RIIL, much prior to that .


However, it is learnt that RIL is planning to make RIIL as a gas carrier & distribution company. Reliance Gas Transportation Infrastructure Ltd. (RGTIL) is a closely held company of Mukesh Ambani, which had put up 1,400 kms., 48 inches diameter pipeline from Kakinada to Bharuch, capable to transport 120 mmscmd of gas , having set at a project cost of Rs. 15,000 crores. The present paid up equity of RGTIL is at Rs. 700.05 crores with face value of Re.1 and are presently held by 6 private limited companies, with each company holding 1166.75 million shares. In addition to this, it has Preference Share Capital of Rs. 330 crores, with face value of Rs. 10 each. This company is capable to generate a revenue of Rs. 700 crores, if we presume a transport of 80 mmscmd at US$ 0.13 per mBtu.


Apart from this, RIL has plans to set up gas pipelines in various parts of the country, originating from KG Basin, as also to take up gas distribution for domestic households in over 150 cities, of the country.


It is learnt that the Group is contemplating to bring all this pipeline network and business into RIIL, with a view to attain leadership in the sector. This move was also expected in the past, but got deferred due to delay in gas production by RIL from KG Basin.


Maybe now, if this gets implemented, RIIL paid up equity, which is now at Rs. 15.10 crores may get raised to Rs. 100 crores with promoters’ holding of 90%, which is allowed for an infrastructure company. The whole exercise is aimed with a view to raise US$ 2 Billion for new projects. This will be possible only if RIIL has a mega size of projects coupled with respectable market capitalisation.


RIIL has a market cap of Rs. 1,240 crores, inspite of recent surge in the share price, which is not befitting to the level of RIL Group. So, if these plans are required to get implemented. RIIL must become a $4 billion company in terms of size of assets and market capitalisation.


We hope that these expected plans are implemented by the Group this time for RIIL and not to indulge in market operations again.

By SP Tulsian

Sunday, April 12

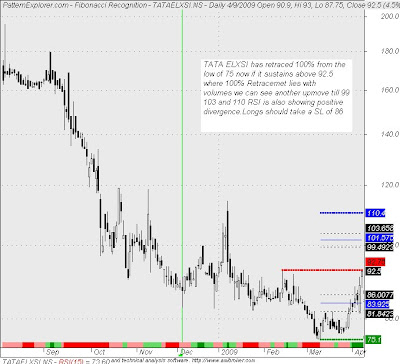
Technical Analysis of TATA ELXSI


Click on Image to Enlarge

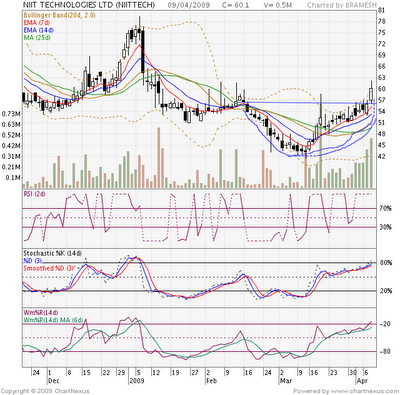
NIIT Technologies Technical Chart


NIIT Tech Has made Both Inverted H&S Breakout and Trend line Line Breakout with volumes above 55 which gives a tgt of 67 and 75 RSI has also given a positive divergence SL should be at 55 for long initiated.

Nifty and Stock Specific Trading Ideas for 13-17 April

Dear All,

Nifty has formed Doji in EOD charts.Doji usually stands for a Trend reversal which looks unlikely in the current scenario to most of the people,But wait markets have there mind of own and we can just speculate in the Extreme short term.

Now resistance for Nifty comes at 3437 which is 200 MA.

Technically speaking we are in overbought zone and we may see corection in near term.

Nifty 5 EMA stands at 3254 while NIfty is at 3342 so a Diffrence of 92 Points which needs to be retraced,Now if bity is unable to cross 3437 we short it for a tgt of 3200.

It is better to buy 3200 PE and 3100 PE if NIfty is unable to cross 3437 and if it able to cross that than get ready for a 200 points move on which i am a bit circumspect.

Stock Specific

RIIL which posted a Breath Taking Rally in 1 week noww faces resistance at 923.Short at that levels for a tgt of 850 Sl 950

NTPC above 208 will give a tgt of 216

MOser baer which looks a bit overbought should be bought on dips till rs 60 for a sl of 56 tgt 76 and 80

Relaince faces resiatnce at 1800-1825 can be shorted at that levels

Torrent Power can see 123 above 114 trade with a sl of 96

Regards,

Bramesh

Friday, April 10

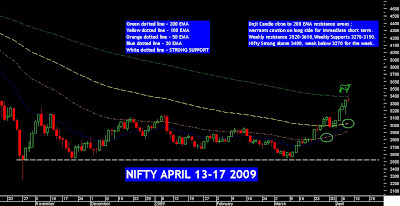
Nifty technical Analysis for 13-17 April


Click on Image to Enlarge and Read the Levels

Sayings on Stock Markets Must Read for Traders and Investors.

One of the Funny Thing about Stock Markets is that Every Time One Man Buys, Another Sells, And Both Think They Are Astute - Henry Ford
Profoundly exhibiting the predator's instinct of the players.When there is always going to be a Loser , who is to be blamed. While educating the unfortunate one, stock markets operate with the only principle that for every winner there is always a loser and Exchanges are Neutral. This
This primarily applies for secondary market investment. When the capital does not form the core of the business then the investment becomes pure speculation and based on perceptions. So shall be the returns. The values get higher and higher changing hands until it bursts. The cycle continues.

It’s human nature to find patterns where there are none and to find skill where luck is a more likely explanation (particularly if your’re the lucky [mutual fund] manager).” -Bernstein,William


Derivatives are the perfect example and the disappearance of big names in the recent days
The human ego to win at any cost is perfectly exhibited in stock markets.

The price of a scrip oscillating every day and every trading hour of the day in the name of price discovery when the business does not change in a given period. Too much of speculation and participation by media in creating a hysteria of a particular stock and perceptional value driving the price, the new age investor should be prepared for all eventualities of his trading decisions and do it with the clear knowledge that only the laws of the jungle will prevail.


The final inference for all stock market players - Making Money in Stock Markets Consistently will be a Perception as to Emperor's New Clothes.

Wednesday, April 8

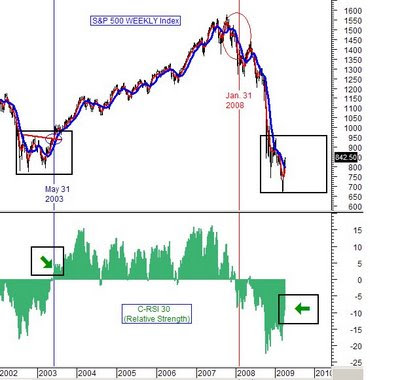
IS Rally in S&P is Bear Market or Bull Market ?


This chart is a simple, weekly chart of the S&P 500 showing the end of of the last Bear Market compared to where we are on this one.

The last Bear Market ended when the S&P broke a trend line to the upside, AND when its C-RSI (Relative Strength) reading went positive.


Now in the current scenario S&P is still not able to cross the Trend line and C-RSI is in neagtive region which adds to the fact that we are still in Bear market and it is a bear market rally.

Now, look at where we are and forget what the TV pundits and analysts are telling you.


Monday, April 6

HangSeng Market Technical View

The Hang Seng Index broke through 14000 and is headed for a test of the December/January highs at 15800. Breakout above 15800 would complete a wide double bottom reversal, offering a target of 21000 (calculated as 16000 + [ 16000 - 11000 ]). Twiggs Money Flow (21-Day) respecting zero from above signals buying pressure, while Twiggs Money Flow (13-Week) completed a bullish divergence, crossing above zero to indicate primary trend reversal. Respect of resistance, while less likely, would warn of another test of 11000.

Twiggs Money flow Indicator shows Momentum still Left

The Sensex is testing resistance at 10500; breakout would confirm reversal to an up-trend. Twiggs Money Flow (13-Week) shows a strong bullish divergence. Respect of resistance, while unlikely, would warn of another test of 8000.

Sunday, April 5

Nifty Views and Few Trading Ideas for April 06-09

HI all,

Nifty is poised at a crucial juncture at this point of time A close above 3250 will take us to 3400 levels and if unable to cross and 3150 and 2980 are held the uptrend will resume.Statergy should be to buy on dips rathter than to Sell at rise.

As it being Holiday shortened week with Tueday on eve of Mahaveer Jayanti and Friday Being HOliday Volumes are likely to dip and Volatility to Remain High.

Also Nifty has seen 3 sharp bear market rally in this correction phase and all are making lowers lows and lower bottom.

Now the best strategy would be to play in at the money option,3200 CE was a money doubler and w booked a liitle ealy but still we should not be greedy, as we will get ample opputunity.

As of now we are having open positions in 3000 PE taken at 46


Please refer to nifty weekly charts for support and resistance.

Stock Specific:

ICICI buy at dips near 345-350 for a tgt of 387 and 400
Reliance moving towards upper band in channel and should be shorted near 1710 or bought at dips 1580-1610
SRF buy above 81 for a tgt of 95-100 sl 71
Century Textile buy nead 219 sl 205 TGt 230 255

For live intra day calls Join
http://tagg.in/taggtivity.php?q=38745

For your stock specific Queries Mail @ bhandaribrahmesh@gmail.com


Regards,
Bramesh
9985711341

Saturday, April 4

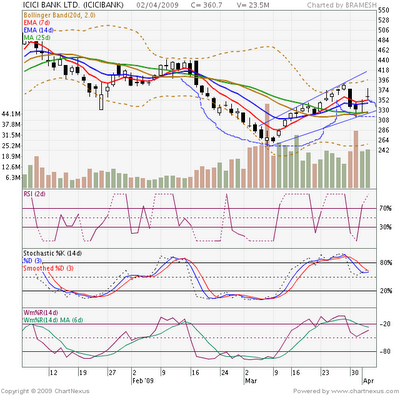
ICICI Technical Chart Cups and Saucer PAttern

ICICI is forming Cups and Saucer and Falling Wedge Pattern Both Signalling a reversal Pattern

Further 387 is 100% Retracement from low of 314

As predicted from the pattern 385-387 is proving to be a resistance zone above which it can rally upto 396 and 414

Wait for a dip till 345-350 wiath a sl at 323 to buy this stock for a tgt of 70-387 and 414

DIVIDEND YIELD STOCKS : BEAR MARKET LIFEBOATS

When the markets are down and stocks are cheap like, it is an opportunity to look for high dividend yield stocks. . As long as you hold the stock concerned and as long as the company continues to pa y dividends at the same rate,your dividend yield is fixed for life, even if the market price of the
stock changes.

Other things being equal , the yield will be higher if you buy stocks at lower price.

When you are not sure how long the bear market will last , a good dividend yield will give you a
steady income and therefore you can afford to forget what the index or stock is quoting at . You
treat the stock more like a fixed deposit where you get your fixed returns. Therefore, you have
less tension.


How to calculate DIVIDEND YIELD?


Dividend Yield:Take Dividend per share for full year and divide that amount with the price at which you acquired the share multiplied by 100.

Eg. Andahra Bank has given Dividend of Rs 4 per share for full year and its closing price on Thursay was around 41

So Dividend Yield will be 4/41*100=9.75% which is more than a Fised Income return you get.

And one more thing ito be noted is Dividen Income is Tax Free, So in return you are earning almost 10% Tax free income.

Other Stocks Being Tata Elxsi which gives a dividend yield of 6.5%.

So with the Plethora of Stock Avilable start searching for Good Dividen Yield Stock in this Bear Market and make uourself a permanet source of tax free Income Voila!!!

Criticism and Comments Invited.

Regards,
Bramesh


Nifty Technical View 06-09 April

Hi All

Nifty Technical Charts shows a strong resistance at 3250 so closing above 3250 is essential for a target of 3400 which is 200 DMA.

But caution is advised on Longs as Negative Divergence is observed in RSI

Now Strategy should be Buy at dips with a sl of 2980

Thursday, April 2

WOCKHARDT - NOT YET ON THE DEATH BED

Wockhardt, India’s seventh largest pharma company by revenue is witnessing a huge debt burden. It has a debt equity ratio of 2.3:1 as at 30/09/08. The total debt of the company is at Rs.3,400 crore while its net worth is at Rs.1,490 crore. The company has decided to approach the Corporate Debt Restructuring (CDR) cell through its lead banker – ICICI Bank.

The reason for the mounting debt has been the overseas acquisitions made by the company in the last two years. It had acquired Ireland based Pinewood Lab for $150 million, then the France based Negma Lab for $265 million and US based Morton Grove Pharma for US$ 38 million. This has constrained the fund raising ability of the company.

Even FCCB of $110 million is becoming due for redemption on 25/09/2008 with liability of $142.54 million, with interest calculated thereon. These FCCBs will not get converted, as its conversion price is Rs.486 per share. Promoters of the company, who own 74% stake have already pledged 79.21% of this and hence unable to do much on their own.

It has been reported in some sections of the media that the company is trying to offload part of its stake in Wockhardt Hospital, a company which could not succeed in raising Rs.650 crore through its IPO in Feb 08. Wockhardt does not have any stake in Wockhardt Hospital, as 82% of its stake is held by Dartmour Holdings P.Ltd, a closely held company of Khorakiwala family, with H.F Khorakiwala holding 97.56% in it. 9.09% each, is held by Carol Info Services Ltd, a listed arm and H.F Khorakiwala. Even this company is reported to be having a debt of over Rs.500 crore. Maybe, by diverting major stake in this company, Khorakiwalas can realize a good amount, which can be brought in by them in Wockhardt to repay part of the debt.

If we look at the financials of Wockhardt, it is quite strong with a tiny equity base of Rs.54.70 crore. For the year ending Dec 07’, the total income of the company, on consolidated basis, was placed at Rs.2665 crore with a PAT of Rs.386 crore, resulting in an EPS of Rs.35, with a net worth of Rs.1,275 crore as at 31/12/07, giving a book value of Rs.116 per share.

Even for the first 9 months ending 30/09/08, the total income of the company, on consolidated basis, was at Rs.2,652 crore with a PAT of Rs.219 crore. This has resulted in net worth rising to Rs.1,495 crore as at 30/09/08.

If we take a look at the financials of the company, it becomes evident that it is not as precariously perched as being made out to be by various sections of the media. The company is estimated to have an annual sales of Rs.3,500 crore of which, Rs.2,200 crore may come from Europe and USA, based on the past data. Generally, on a global parameter, an established pharma company like Wockhardt, gets valued at 3 times of its topline. This means, it can get a valuation close to Rs.10,000 crore and if we deduct the debt of Rs.3,400 crore, it can have a net enterprise value of Rs.6,600 crore, resulting in a value per share of Rs.600.

The promoters having already pledged its 79% stake may divest its majority or total stake in Wockhardt Hospital, to raise between Rs.750 crore to Rs.1000 crore, which in turn, can be used by them to meet FCCB redemption in September 09’. They can either bring in fund as unsecured loan or by issuing shares on a preferential basis. If the promoters opt to raise money, using the preferential mode, they can raise their stake beyond 80%, which will trigger an open offer. Alternatively, if promoters opt to divest some of its overseas subsidiaries, it can bring back the company on it own feet. Lastly, if part stake sale is contemplated, it could also trigger an open offer.

In all the cases, the minority shareholders would tend to gain, as promoters will not leave the company in a lurch. Share at Rs.75 holds tremendous value and potential for those, who have a 12 months view on the stock. Any positive news of the promoters being able to mobilize funds would change the fundamentals of the stock.


By SP Tulsian

Wednesday, April 1

Reliance Technical Chart Short if unable to cross 1610


Reliance needs a breather now 1600-1610 Trendline resistance Negative divergence in RSI and Stoch Arrons Oscillator at 100

SUGAR SECTOR - Best is yet to come

We have been maintaining our bullish view on the Sugar sector since Nov.08, mainly on the expectations of lower production in the country. When the Govt. has been estimating country’s production at 22 million tonnes (mt) for season 08-09, in Nov. 08, we expected it to be 18.5mt. On collecting details of production on all India basis, upto 15-3-09, it is estimated at 13.1 mt. Season 08-09(expiring in Sept 09) is not likely to see a production of more than 15mt.

The reason for lower production is low yield per hectare of sugarcane crop, lower sugar recovery by the mills, farmers migrating to other crops like wheat, rice and potato and lesser number of running of mills across the country due to lower availability of sugarcane, even after paying higher rate above SAP in U.P.

If we consider opening stock of 8mt and an expected import of 2mt of raw sugar with estimated domestic production of 15mt, we will be having 25mt against our annual domestic consumption of 23mt. Therefore, as at 30-9-09, we will be left with a closing stock of just 2 mt which would be very alarming.

Though the Govt. is contemplating allowing import of white sugar at 0 duty against present rate of duty at 60%, but the same is not feasible and workable. Taking a price of $395 per tonne and a freight of $35 per tonne and adding a cost of Rs. 1,000 per tonne as port handling, insurance and transport the landed cost of white sugar works out at Rs. 23 per kg. against ex-mill price of Rs. 20 per kg. in Maharashtra and Rs. 21 per kg. in U.P.

Even import of raw is now not feasible unless the importer is confident of realising above Rs.23 per kg. Due to the lower raw price in Dec. 08, importers have contracted to import about 9 lakh tonnes of raw sugar. These include 5.25 lt by Shree Renuka Sugars, 90,000 tonnes by NCS Sugars, 50,000 tonnes by Dalmia Sugars, 40,000 tonnes each by Simbhaoli, Dharani and Rana Sugars, 25,000 tonnes each by Dhampur Sugar and the EID Parry-Cargill refinery at Kakinada, and 22,000 tonnes by the KK Birla Group. Since February 20, not a single new contract has been entered into.

Realising this shortage and hoping that this does not spoil the mood of the voters due to an expected steep rise in the price of sugar (as sugar , onion and potato are very sensitive items during elections, making Govt. to loose it) the Govt is making all the efforts to keep retail price within Rs. 25 per kg. till elections get over. This price control is achieved with free market release mechanism, releasing buffer stock created by the Govt. last year, inventory limits having imposed on the traders and by asking mills to go slow on price hike for a month or so.

Once the last phase of election gets over by 13th May it is certain that ex-mill price of sugar will rise to about Rs. 24 per kg. in next couple of months. This in turn will see a retail price of Rs. 28 per kg. Hence, mills carrying stock will reap windfall gain on its inventory. Also, Tamil Nadu mills will be at an advantage as they will continue to produce with estimated number of crushing of about 220 days. Those mills also have the benefits of lower cane price and higher realisation of Molasses.

Hence, sugar companies with higher inventory held by them will be making good profits which would get reflected in its share price from mid May. It is expected that all the sugar stocks would be able to rise by about 50% from its current levels in the next 5-6 months.