Thursday, March 31

Nifty sees 4 quarter of correction, EOD Analysis

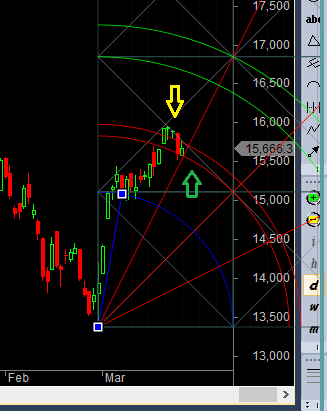
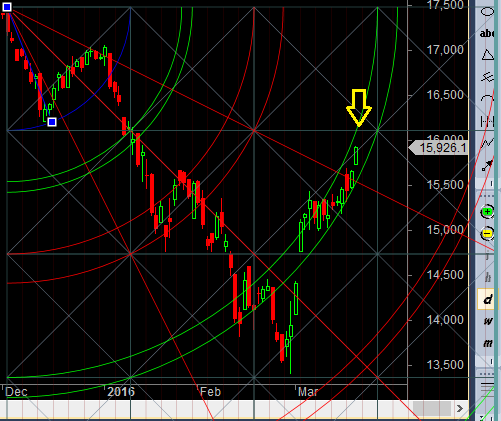
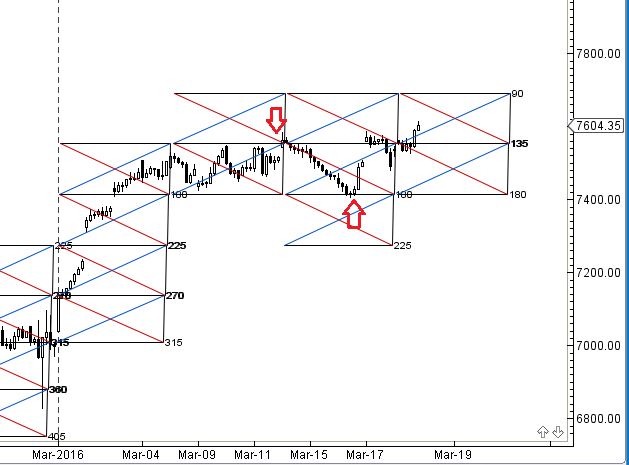
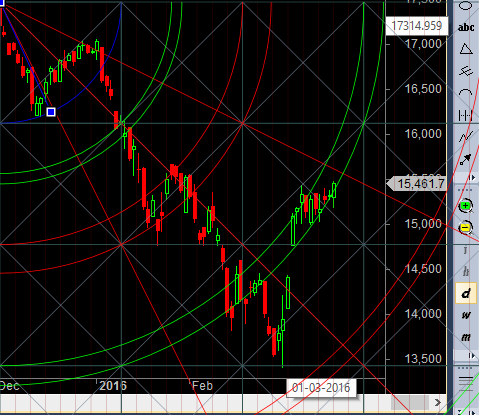
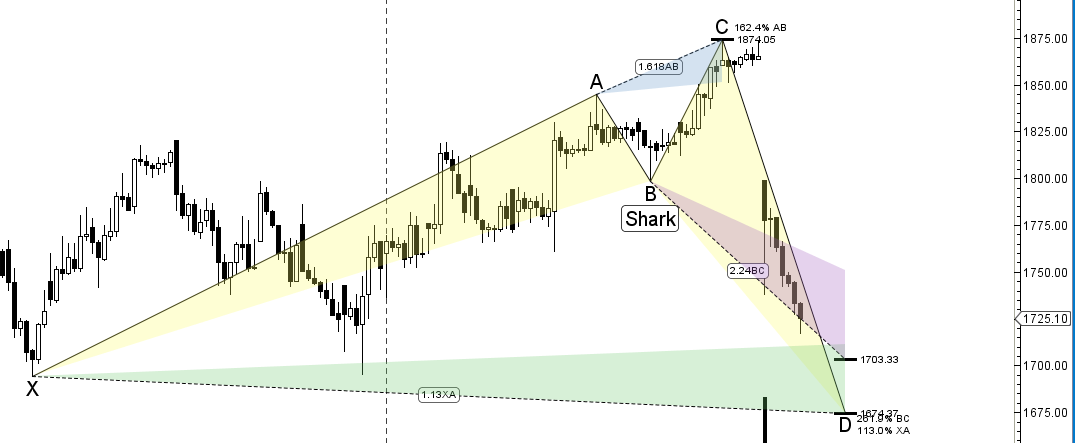
  • As discussed in Last Analysis   Support is again at 7550 and resistance in range of 7780-7800. High made today was 7777, as nifty reacted from demand zone, Nifty has risen 767 points in March series and formed a hammer pattern on Quarterly chart,  As seen in below chart nifty has corrected for 4 quarters in a row and it has happened 3 time before, and every time market has rallied, Will History repeat itself needs to be seen. Bank Nifty forms doji near supply zone, EOD Analysis
Quaterly


Continue Reading

Bank Nifty forms doji near supply zone, EOD Analysis

 As discussed in last analysis  16200-16229 is important supply zone for bank nifty, closing above it  we can see move towards 16800 on/before RBI policy. Support will increase to 15700-15750 range. Bank Nifty unable to close above the supply zone, and also took resistance at the gann horizontal as shown below. Bank Nifty has rallied 2585 point in the March expiry and ended the series with a DOJI candlestick,  Supply zone is range of 16229-16250 and Demand zone is back to 15700-15750. Trader's Resolutions for the New Financial Year 2016-17
Continue Reading

Trader's Resolutions for the New Financial Year 2016-17

With the advent of New Financial Year 2016-17 from 1 April 2017  we all should make resolution for improving our trading results for coming Financial year.
Trader should DARE the Mr Market for 2016-17. Let me explain it in more details:
Discipline
Analyze
Risk
Education

Discipline

Every time we begin our trading sessions, we need to communicate to ourselves that we will be confident, prepared and most importantly committed to executing trades when our analysis shows that a good trade is in front of us.
Never allow the market, the news, your Social Media friends, your past trading mistakes or anything else send you a false signal that causes you to sit back


Continue Reading

Cipla Dish TV and ONGC Darvas Box Analysis

Cipla

CIPLA


Intraday Traders can use the below mentioned levels

Buy above 515 Tgt


Continue Reading

Nifty approaching final target of Butterfly pattern,EOD Analysis

FII
  • FII's bought 7.8 K contract of Index Future worth 394 cores ,27.6 K Long contract were added by FII's and 19.7 K short contracts were added by FII's. Net Open Interest increased  by 47.4 K contract, so rise in Nifty market was used by FII's to enter  long and  enter shorts in  Index futures.Which type of a trader are you?
As discussed in Last Analysis   Nifty did the exact low of 7583 near shark pattern target. Till we are closing above 7600 Nifty can bounce back to 7800, below 7550 we can see correction till 7360-7380. Nifty opened with gap up above 7600 continued with
Continue Reading

Bank Nifty breaks gann arc in style,EOD Analysis

  •  As discussed in last analysis   The range is important as its falling in gann 1 arc and near gann trendline as shown in below chart, so break of 15500 or 15800 will give another 250-300 point move.Nifty made low of 15762 and opened above the gann arc, and once 15800 was broken gave the 300 point move we were looking for. Never follow new, follow levels with proper risk management market has everything factored in.16200-16229 is important supply zone for bank nifty, closing above it  we can see move towards 16800 on/before RBI policy. Support will increase to 15700-15750 range.  Which type of a trader are you?
breaking gann arc


Continue Reading

Wednesday, March 30

Which type of a trader are you?

Greedy Traders: They trade too big and risk too much because their only goal is the easy money. They usually end up blowing up their account.
 
New Traders: They have no idea how the markets work so their only goal should be knowledge. New Traders do well to stay students until they have done their homework. Rushing in to make money without risk management, a winning method, the right mind set, and a trading plan will result eventually in failure 100% of the time.
 
Arrogant Traders: Their only goal is to prove they are right and satisfy their fragile egos. Arrogant traders will lie, delete tweets and posts, never admit when they are wrong. When they are wrong they will hide it under a cloak, when they are right they will scream it from the roof tops.
 
Trend Traders: Their only


Continue Reading

KSCL ICICI Bank and Auro Pharma Supply Demand Analysis

KSCL

KSCL

Intraday Traders can use the below mentioned levels

Buy above 380 Tgt..


Continue Reading

Tuesday, March 29

Nifty does Shark Pattern Target,EOD Analysis

FII
  • FII's bought 3.9 K contract of Index Future worth 207 cores ,30.3 K Long contract were added by FII's and 26.3 K short contracts were added by FII's. Net Open Interest increased  by 56.6 K contract, so fall in Nifty market was used by FII's to enter  long and  enter shorts in  Index futures.Traders Success Model
As discussed in Last Analysis   Nifty did the exact low

Continue Reading

Bank Nifty stuck in gann arc,EOD Analysis

  •  As discussed in last analysis  Now support is again in range of 15500-15381 and resistance above 15830. Low made today was 15580 and High 15774, so trading in the range.  The range is important as its falling in gann 1 arc and near gann trendline as shown in below chart, so break of 15500 or 15800 will give another 250-300 point move.    Traders Success Model
Bank Nifty gunner resistance

Continue Reading

Monday, March 28

Nifty corrects from Channel Resistance,EOD Analysis

FII
  • FII's bought 2.2 K contract of Index Future worth 160 cores ,17.3 K Long contract were liquidated by FII's and 15.1 K short contracts were liquidated by FII's. Net Open Interest decreased  by 32.4 K contract, so fall in Nifty market was used by FII's to exit long and  exit shorts in  Index futures.Traders Success Model
As discussed in Last Analysis   Nifty formed Inside day candle near channel top suggesting coming 2 trading days are very crucial as we can see fast move in market. Gann Time Analysis helped again coupled with channel resistance and Inside day  as we saw Big trending move


Continue Reading

Bank Nifty corrects from Channel Resistance,EOD Analysis

 As discussed in last analysis   Bank Nifty updated butterfly pattern is shown below, PRZ zone comes in range of 16000-16080, where we are also seeing shark pattern completion also shown below, so range of 16000-16080 is very very crucial till expiry. As seen in below chart, Bank nifty is also near the channel resistance which again forms resistance in range of 15980-16050, So traders needs to closely watch the range, Unable to break on closing basis can see correction till 15500, Low made today was 15522, Bank Nifty has reacted from channel resistance and also Butterfly pattern PRZ and

Continue Reading

Traders Success Model

While You are trading or planing to take a trade, It YOU from making a trade plan till trade execution irrespective of profit and loss.Many traders gives excuses like Market is bad so we lost money , Do remember market is always right its YOU where faults lies into.
Surprised, you really shouldn’t be as you are the one writing your own trading story, so the big question is;
  • Do you really want to be a trader?
  • Do you have ability to become a
Continue Reading

Dr Reddy SRF and IBR Intraday trading levels

DRL

DRL


Intraday Traders can use the below mentioned levels

Buy above 3055 Tgt


Continue Reading

Nifty Weekly Forecast for March Expiry

Last Week we gave Chopad Levels  of 7636 , Nifty gave Long entry on Monday and did 2 targets on Upside by Wednesday. Lets analyses how to trade nifty in Expiry week .

Nifty Hourly Chart

nifty hourly
As discussed in last week Nifty was able to close above 135 degree on weekly basis so we can see move towards 7686.
For coming week as 90 degree is where


Continue Reading

Bank Nifty Weekly Forecast for March Expiry

Last Week we gave Chopad Level 15710 Bank Nifty gave LOng on Monday and did 2 target on upside , Lets analyze how to trade Bank Nifty in coming Expiry Week.

Bank Nifty Hourly

Bank Nifty Hourly

As discussed last week  Coming week we are entering a new channel high at 16056 Low at 15350 so these 2 levels needs to be seen.
Bank Nifty held on to channel and above
Continue Reading

Saturday, March 26

Secret of Success

A young man asked Socrates the secret to success. Socrates told the young man to meet him near the river the next morning .They met. Socrates asked the young man to walk with him toward the river. When the water got up to their neck, Socrates took the young man by surprise and ducked him into the water. The boy struggled to get out but Socrates was strong and kept him there until the boy started turning blue.
Socrates pulled

Continue Reading

Friday, March 25

Nifty forms Inside Day near channel top,EOD Analysis

FII
  • FII's bought 12.3 K contract of Index Future worth 739 cores ,7.8 K Long contract were added by FII's and 4.5 K short contracts were liquidated by FII's. Net Open Interest increased  by 3.3 K contract, so rise in Nifty market was used by FII's to enter long and  exit shorts in  Index futures.Whats your trading style: Day Trading or Swing Trading
As discussed in Last Analysis   So range of 7780-7800 become very crucial for next 2 trading days, short term correction can be seen if we close below 7634 towards 7500-7550, Low made was 7670, Nifty continue to rise for 6 days in a row, also formed Inside day candle


Continue Reading

Bank Nifty forms Inside Day near channel top,EOD Analysis

  •  As discussed in last analysis   Bank Nifty updated butterfly pattern is shown below, PRZ zone comes in range of 16000-16080, where we are also seeing shark pattern completion also shown below, so range of 16000-16080 is very very crucial till expiry. As seen in below chart, Bank nifty is also near the channel resistance which again forms resistance in range of 15980-16050, So traders needs to closely watch the range, Unable to break on closing basis can see correction till 15500, Closing above 16100 can see fast move till 16600/17000. Bank Nifty has formed an Inside Day Candlestick pattern on last trading day.Bank Nifty  Support has increased to 15555-15600, Resistance in range of 16000-16050.  Are You Emotional Trader ?

Bank Nifty Weekly Bias
Continue Reading

Thursday, March 24

Whats your trading style: Day Trading or Swing Trading

To be a successful trader you need to find a "Trading Style" which suits you "THE BEST" , in terms of risk appetite, stress,money management. A trader who is not comfortable with his trading style or has not found trading style are the one who commits the trading sins and blow of their trading account.
Trading can be broadly classifies into:
  • Day trading
  • Swing trading or Positional Trading.
Let's define these two terms:
  • Day Trading is also known as 'Intraday'. It  means opening and closing a position within the same trading day. Traders who are interested in scalping,quicker and smaller  profits and trading on leverage and who can make multiple trades per day work on this strategy.
  • Swing Trading means that you are trying to take advantage of larger price swings in the markets. Traders will carry positions for few days to 2-3 weeks. Trades can be taken based on Gann/Harmonics/Price Action trading methodology to find swing trades.
So which trading approach is better - Swing trading or day trading? Traders can look to either day trade or swing trade, the benefits and drawbacks are
Continue Reading

Understanding Arms Index

The Arms Index (also known as TRIN, an acronym for TRading INdex) was developed in 1967 by Richard Arms. It is a volume-based indicator that determines market strength and breadth by analyzing the relationship between advancing and declining issues and their respective volume. The Arms index is used to measure intraday market supply and demand, and it can be applied over short or long time periods, though it is primarily used as a short-term trading tool.

Calculation
The Arms Index is calculated by first dividing the number of stocks that advanced in price by the number of stocks that declined in price to determine the Advance/Decline Ratio. Next, the volume of advancing stocks is divided by the volume of declining stocks to determine the Upside/Downside Ratio. Finally, the Advance/Decline Ratio is divided by the Upside/Downside Ratio.

The Arms index is calculated as follows:

TRIN = (advancing issues/declining issues)
(volume of advancing issues/volume of declining issues)


Continue Reading

Holi Wishes And Life Lessons From The Festival Of Colors

Auspicious red.Sun kissed gold.Soothing silver.Pretty purple.Blissful blue.Forever green.I wish u N all family members the most colorful holi to all Blog Readers.
Holi is a Sanskrit word which is also known as Spring Festival  and sometimes, also referred to as the Festival of Love.
 

Messages Of Love, Celebration And Harmony


1. Evil May Seem Powerful But It Loses In The End


Continue Reading

Wednesday, March 23

Why only small fraction of traders become Professional Traders

Why do most fail?

No Passion for Trading

When people come into the world of trading many think that they only need to learn a strategy and follow the rules of that strategy. And, there are some people who actually do this for awhile. The problem with those who do not first get a good foundation of the markets is that when the markets change or when they have a drawdown, they start making mistakes. Those mistakes lead to a viscous cycle of getting back your money from market and ultimately lead to burst of trading account.
There are those who are only trading to

Continue Reading

Cummins Havells and SBI Harmonic Analysis

Cummins

Cummins

Positional/Swing Traders can use the below mentioned levels

Close above 898 Tgt 932/953

Intraday Traders can use the below mentioned levels

Buy above 890 Tgt


Continue Reading

Tuesday, March 22

Nifty near channel resistance,EOD Analysis

FII
  • FII's bought 2.8 K contract of Index Future worth 200 cores ,4.9 K Long contract were added by FII's and 2.1 K short contracts were added by FII's. Net Open Interest increased  by 7 K contract, so rise in Nifty market was used by FII's to enter long and  enter shorts in  Index futures.Are You Emotional Trader ?
As discussed in Last Analysis    So we have a close above 7634 suggesting market heading towards 7800/7859 odd levels till we close above 7634. Support are now at 7550-7500. Nifty again made low of 7643 which is near the zone of 7634 and made high of 7728, Now we have Weekly closing tomorrow and we are also near the channel resistance and gann horizontal line as shown in

Continue Reading

Bank Nifty forms hanging man,EOD Analysis

  •  As discussed in last analysis  Bank Nifty made high of 15945 where it complete the Butterfly pattern also as discussed in Weekly Analysis Bank . Now Next 100 points range of 15945-16049 is very crucial where we will see lot of supply coming, unable to cross Bank Nifty can see 200-300 point correction. Bank Nifty updated butterfly pattern is shown below, PRZ zone comes in range of 16000-16080, where we are also seeing shark pattern completion also shown below, so range of 16000-16080 is very very crucial for coming 5 days as we have trading holiday after tomorrow. Bank Nifty  Support has increased to 15555-15600, Resistance in range of 16000-16050.  Are You Emotional Trader ?
Bank Nifty

Continue Reading

Are You Emotional Trader ?

Emotions plays vital role in trading success and failure. Emotional trader can never be able to  trade profitably as An emotional trader is likely to act impulsively and make trading errors. Emotions of Greed can come when you are in good profits instead of booking you get overpowered by your emotion and move away from your trading plan and continue holding position thinking of getting more profits and eventually exit in loss.


Continue Reading

Kotak Bank BEML and Jubilant Food Channel Analysis

Kotak Bank

Kotak Bank

Positional/Swing Traders can use the below mentioned levels

Close above 665 Tgt 699

Intraday Traders can use the below mentioned levels

Buy above 665 Tgt


Continue Reading

Bank Nifty shows impulsive move above gann trendline,EOD Analysis

  •  As discussed in last analysis  bank nifty was facing difficulty near 15555-15580 was due to gann resistance line, Holding the same Bank Nifty can scale towards 15800/16000 which is the next horizontal line of resistance.  Bank Nifty made high of 15945 where it complete the Butterfly pattern also as discussed in Weekly Analysis Bank . Now Next 100 points range of 15945-16049 is very crucial where we will see lot of supply coming, unable to cross Bank Nifty can see 200-300 point correction. Nifty  Support has increased to 15555-15600, Resistance in range of 16000-16050.  Does it Hold True Let your Winners run and Cut your losses
Gann Line crossing bank nifty

Continue Reading

Nifty rallies above 7634,EOD Analysis

FII
  • FII's bought 2.8 K contract of Index Future worth 251 cores ,4.3 K Long contract were liquidated by FII's and 7.1 K short contracts were liquidated by FII's. Net Open Interest decreased  by 11.5 K contract, so rise in Nifty market was used by FII's to exit long and  exit shorts in  Index futures.Does it Hold True Let your Winners run and Cut your losses
As discussed in Last Analysis   Nifty gann arc again helped us and bulls showed true colors by closing at 7600 and also closing above the gann trendline . Close above 7634 is important for a move towards 7800/7900, Bears have chance only on close below 7450. So we have a


Continue Reading

Monday, March 21

Does it Hold True Let your Winners run and Cut your losses

Today we will start discussion on widespread misconception that are floating around the trading community and gets lodged into traders minds. I have been talking to many traders every week, during our talks these misconception will finally come up. A lot of these are inaccurate and ineffective ideas,which lead traders into a cycle of bad trading habit and causes them to lose hard earned money in the markets to professional traders.
Lets discuses the one of  most erroneous trading belief many trader posses and hopefully after reading the lesson will be able to think differently.

1. Let your Winners run and Cut your losses.

We hear, read old adage "Ride on Winners and cut down your losses" . The same can be found on any trading book/website you come across. But this is very subjective term

Continue Reading

Hindalco BEL and Wipro Darvas Box Analysis

Hindalco

Hindalco


Positional/Swing Traders can use the below mentioned levels

Close above 86  Tgt 89/92

Intraday Traders can use the below mentioned levels

Buy above 86.5 Tgt


Continue Reading

Sunday, March 20

Bank Nifty continue the upmove,Weekly Analysis

Last Week we gave Chopad Level 15360 Bank Nifty gave Short on Monday and did 1 target on downside, Longs taken on Wednesday did 2 target on Upside by Friday. Lets analyze how to trade Bank Nifty in coming Week as we have 2 trading Holidays.

Bank Nifty Hourly

Bank Nifty Hourly

As discussed last week Till Holding above 21/34 EMA bulls are in control for a rise till channel top near 15700/15800
High made 15704 and Low made was 15178

Continue Reading

Nifty continue the upmove,Weekly Analysis

Last Week we gave Chopad Levels  of 7555 , Nifty gave short entry on Monday and did 2 targets on downside by Wednesday and gave long entry on Friday which gave 1 Target on Upside by Friday.   Lets analyses how to trade nifty next week as we have 2 trading Holidays on Thursday and Friday.

Nifty Hourly Chart

Bounced from 180
As discussed in last week Resistance at 135 comes @7555 closing above it can see move towards 7686/7700. Unable to close above 135 can see downmove till 7406, So


Continue Reading

Saturday, March 19

Nifty Breaks gann trendline,EOD Analysis

FII
  • FII's bought 7.6 K contract of Index Future worth 490 cores ,16.1 K Long contract were added by FII's and 8.4 K short contracts were added by FII's. Net Open Interest increased  by 24.5 K contract, so rise in Nifty market was used by FII's to enter  long and  enter shorts in  Index futures.How To Get What I Want
As discussed in Last Analysis  Nifty opened with gap up made high of 7585 and again unable to close above both gann trendline and demand zone of 7554, but again was able to held on to gann arc, suggesting bulls are in control. Nifty gann arc again helped us

Continue Reading

Bank Nifty Breaks gann trendline,EOD Analysis

  •  As discussed in last analysis Bank Nifty opened above the gann resistance line but was unable to sustain above it, but closed above the gann arc as shown below suggesting bulls are still in control. Bank Nifty made low near the gann support of 15452 and bounced back sharply above 15555, the way bank nifty was facing difficulty near 15555-15580 was due to gann resistance line, Holding the same Bank Nifty can scale towards 15800/16000 which is the next horizontal line of resistance.  Bank Nifty  Support has increased to 15400-15450, Resistance in range of 15750-15800.  How To Get What I Want
Gann Line crossing


Continue Reading

Friday, March 18

How To Get What I Want

How to get what I want? You've heard the expression, "What you see is what you get." My grandfather used to say: "If you look at a tree long enough, it will move." We see what you want to see.
Psychologists tell us that nothing controls our live more than our self-image. We live like the person we see in the mirror. We are what we think we are. If you don't think you'll see be successful, you won't. You can't be it if you can't see it. Your life is limited to your vision. If you want to change your life, you must change your vision of your life.

  Arnold Schwarzenegger was not that famous in 1976 when he met with a newspaper reporter. The reporter asked Schwarzenegger."Now that you've retired from bodybuilding, what do you plan to do next?"
Schwarzenegger answered very calmly and confidently: " I'm going to be the #1 movie star in Hollywood."


Continue Reading

Adani Ports CESC and Bharat F Supply Demand Analysis

Adani Ports

Adani Port

Positional/Swing Traders can use the below mentioned levels

Holding 233  Tgt 241/246

Intraday Traders can use the below mentioned levels

Buy above 236 Tgt


Continue Reading

Bank Nifty unable to close above gann trendline,EOD Analysis

  • We expected a move of 400-500 points above 15452, Bank Nifty did 300 points move High made was 15704, Bank Nifty opened above the gann resistance line but was unable to sustain above it, but closed above the gann arc as shown below suggesting bulls are still in control. Close above 15555 is required for next leg of upmove and close below 15136 is required for serious correction. After a big rally we saw in 1 week of march bank nifty is just doing time correction by trading in a range. Support has increased to 15250-15300, Resistance in range of 15660-15700.  How to fight with Trading Emotions
Bank Nifty Gann Trendline resistance

Continue Reading

Nifty unable to close above gann trendline,EOD Analysis

FII
  • FII's bought 10.7 K contract of Index Future worth 591 cores ,7.1 K Long contract were added by FII's and 3.6 K short contracts were liquidated by FII's. Net Open Interest increased  by 3.4 K contract, so fall in Nifty market was used by FII's to enter  long and  exit shorts in  Index futures.How to fight with Trading Emotions
As discussed in Last Analysis  Bulls need close above 7554 for a move towards 7634. Bears below 7400 for move towards 7350/7228, Nifty opened with gap up made high of 7585 and again unable to close above both gann trendline and demand zone of 7554, but again was able to held on

Continue Reading

Thursday, March 17

How to fight with Trading Emotions

Emotions have no place in trading, especially for day traders as their holding period is for few hours only. Most of traders are searching for Magic Indicator or Holy Grail which will lead the desired results and will never cause any loss to them. But in Reality No matter what technical indicator or stock trading system that trader used, results is always the  losses. So where is the real problem It lies in Psyche of trader.
If you want to conquer your trading emotions, Suppose you made a vow you will always put stoploss in all trades you will take from tomorrow onwards. As soon as you place a Stop loss after you took a trade you will face strong resistance internally “What if the Stop loss gets triggered and Stock Bounces back again”.

Continue Reading

REC JSW Energy and M&M Finance Swing Trading With Harmonics

REC

REC

Positional/Swing Traders can use the below mentioned levels

Close above  166  Tgt 178

Intraday Traders can use the below mentioned levels

Buy above 168.8 Tgt


Continue Reading

Wednesday, March 16

Nifty Bounces from gann arc with Hammer Candle,EOD Analysis

FII
  • FII's sold 2.4 K contract of Index Future worth 114 cores ,10.9 K Long contract were added by FII's and 13.3 K short contracts were added by FII's. Net Open Interest increased  by 24.3 K contract, so fall in Nifty market was used by FII's to enter  long and  exit shorts in  Index futures. How "Not learning" from Trading Mistakes can be Disastrous
As discussed in Last Analysis Nifty finally has a correction of more than 100 points, its a slow and steady fall we are seeing from past 2 session, as Nifty was unable to move above the gann trendline as shown in below chart,  Bulls need close above 7554 for a move towards 7634. Bears below 7400 for move towards 7350/7228 else it will be sideways move in small range. Nifty made low


Continue Reading

Bank Nifty near gann trend line, EOD Analysis

  •  Bank Nifty made High of 15489 and low of 15178, so again close above 15136 and able to cross resistance zone of 15440 and also important gann resistance of 15452, So tomorrow we need to see if we close above 15452 and show a follow upmove towards 15555 near gann resistance line and close above it.  Support is now at 15100-15136.How "Not learning" from Trading Mistakes can be Disastrous
Daily Gunner

Continue Reading

How "Not learning" from Trading Mistakes can be Disastrous

Someone Rightly said "Those of us who don’t learn from mistakes are destined to repeat them."
What has happened to Markets in Jan/Feb -2016 was the reminiscent of May 2006. Most of traders had no clue such a big fall can come.
The 11 Most Common Mistakes of a Trader are
 
1. Not Having a Trade Plan.
2. Not Having Money Management
3. Not Using Stop Loss Orders
4. Taking Small Profits and Letting Your Losses Run
5. Overstaying Your Position

Continue Reading

Lupin Amar Raja and NCC Harmonic Analysis

Lupin

Lupin

Positional/Swing Traders can use the below mentioned levels

Close below 1700 Tgt 1674/1652/1631

Intraday Traders can use the below mentioned levels

Buy above 1746 Tgt


Continue Reading

Will Nifty hold gann arc and Demand zone, EOD Analysis

FII
  • FII's bought 10.1 K contract of Index Future worth 553 cores ,2.7 K Long contract were added by FII's and 7.3 K short contracts were liquidated by FII's. Net Open Interest decreased  by 4.6 K contract, so fall in Nifty market was used by FII's to enter  long and  exit shorts in  Index futures. How Long Does it Take to Consistent Income from Trading?
Nifty finally has a correction of more than 100 points,

Continue Reading

Bank Nifty forms Inside Day pattern,EOD Analysis

As discussed in Last Analysis  Bank Nifty has been closing above 15136 from past 6 days, 7 is a gann number so expect trending move in next 2 trading days. Support has increased in range of 14900-15000. Resistance in range of 15400-15440. Bank Nifty made High of 15386  and low of 15268, so again close above 15136 but unable to cross resistance zone of 15440 and formed an INSIDE DAY Candel. Bulls should closely watch 15452, Hourly close above it can see Bank Nifty breaking out of
Continue Reading

Tuesday, March 15

How Long Does it Take to Consistent Income from Trading?

I am often asked during my trading sessions  - how long does it take to learn how to trade ? That is a tough question to answer. The short answer is that a DISCIPLINE and COMMITTED person can learn the basics of trading in a couple months. The long answer is that it can take a lifetime to master, One Life is not enough to master stock market . Its very important to realize for trader, Mastery in trading does not come overnight, It takes Years and years of efforts coupled with burning desire to succeed with setbacks market will offer you.
Since most people just want to make a consistent profit from trading , we will concentrate on the time frame for achieving that.

The One-Year Mark


Continue Reading

Will Nifty Bulls be able to close above Gann Trendline,EOD Analysis

FII
  • FII's bought 14.8 K contract of Index Future worth 861 cores ,8  K Long contract were added by FII's and 6.8 K short contracts were liquidated by FII's. Net Open Interest increased  by 1.1 K contract, so rise/fall in Nifty market was used by FII's to enter  long and  exit shorts in  Index futures. How to Unlock Trading Success
Nifty moved above 7554 but got resisted at gann trend line as shown below, Also unable to close above  supply zone of 7554 as we have been discussing, Bulls need close above 7554


Continue Reading