Saturday, January 31

Has Nifty formed short term top, Weekly Analysis

Last week we gave Chopad Levels  of 8806 Nifty did 2 target  on upside. We saw a roller coaster ride in last week with Bulls were on front foot till Thursday and Friday was the day Bears came back strongly, So have we formed short term top or start of new correction. RBI policy next week on 3 Feb  will keep traders alert.  Lets see how to trade nifty in coming week.

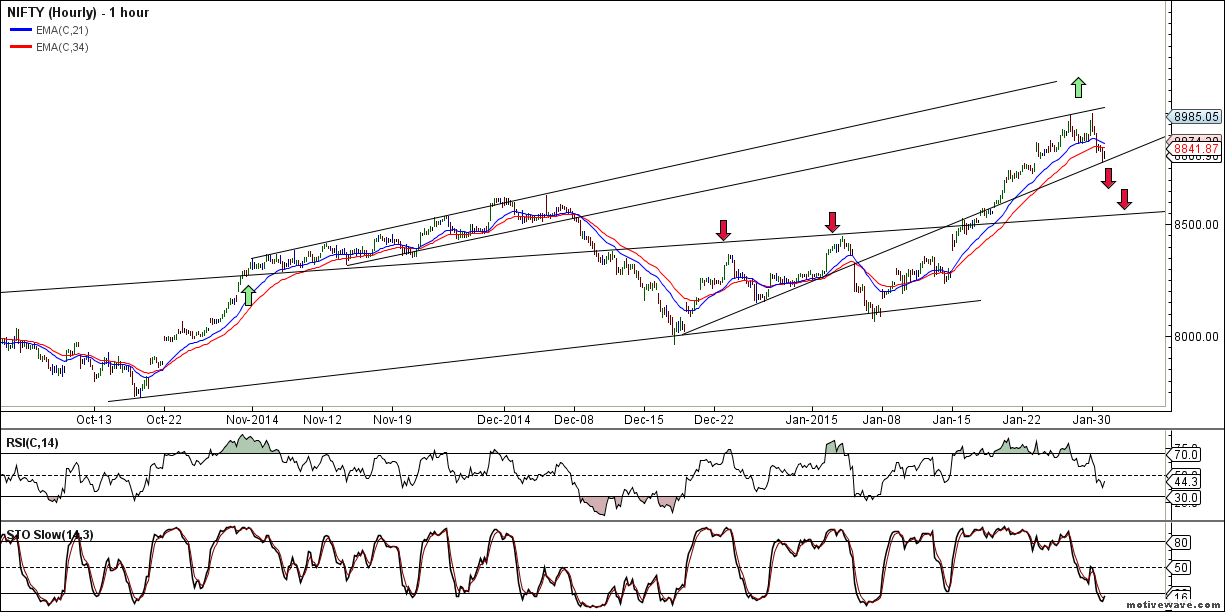
 Nifty Hourly Chart

nifty hourly
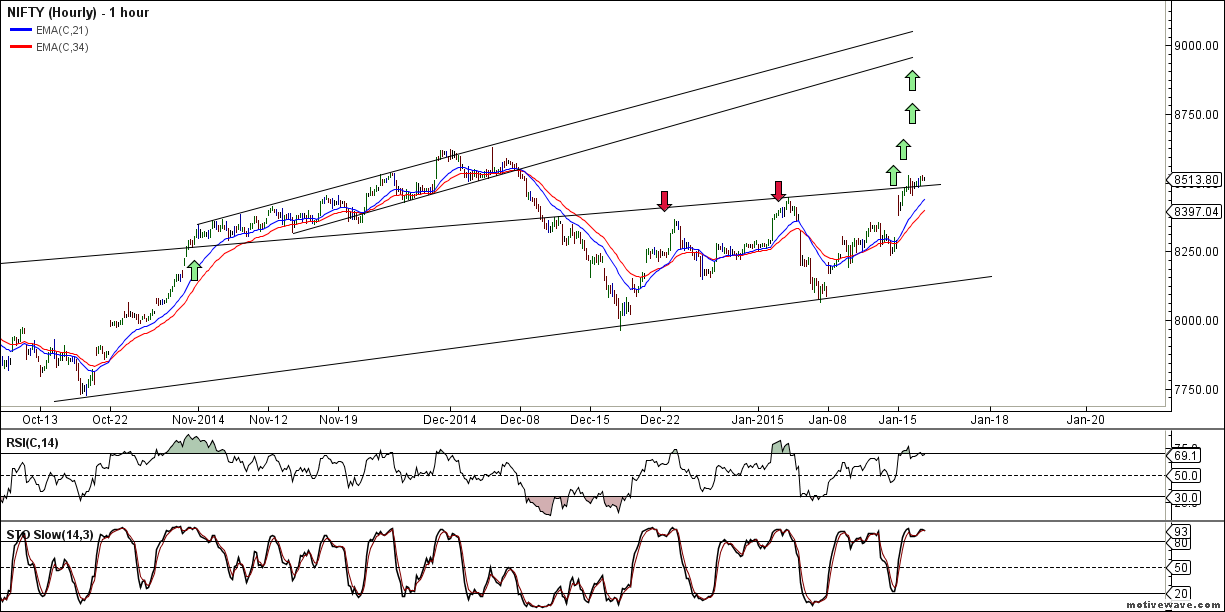
Nifty Hourly charts has broken its both 21/34 HEMA as nifty was unable to cross its trendline resistance, Now nifty is at crucial support of 8774/8754 , breaking the same correction can run deep, able to hold another attempt will me made for new highs.

 Nifty Hourly Elliot Wave Chart

Nifty Hourly EW

Continue Reading

How to trade using Bollinger Bands

You might have heard the saying "The Trend Is Your Friend" and that you should "Trade The Trend."
But sometimes this is easier said than done. In this article I will show you an easy easy to identify and trade the trend.

How To Identify A Trend

Way back in the 90s I used fundamental analysis to try and predict the market. Long story short, it didn't work for me.
Since the mid 90s I have been using technical analysis in my trading. When using technical analysis, there are two different approaches:
  • Chart Patterns and
  • Indicators
Examples of chart patterns are flags, pennants, triangles, double bottoms and tops, etc. Candlestick formations are chart patterns, too.
Examples of indicators are moving averages, Bollinger Bands, MACD, RSI, etc.
So which approach is "better"? Should you use chart patterns or indicators to identify the direction of the market?
Easy answer: Use the approach that works for YOU. I personally use indicators. I like the black-and-white approach of indicators. As an example, the RSI is either above 70 or it is not. There's no grey area. I openly admit that I struggle identifying chart patterns while they are forming. Don't get me wrong: I am an expert showing you every single chart pattern there is at the end of the day. But I can't identify them with certainty while they are forming. But hey,..

Continue Reading

Friday, January 30

Nifty heading for Monthly breakout, Will Bulls succeed ?

FII
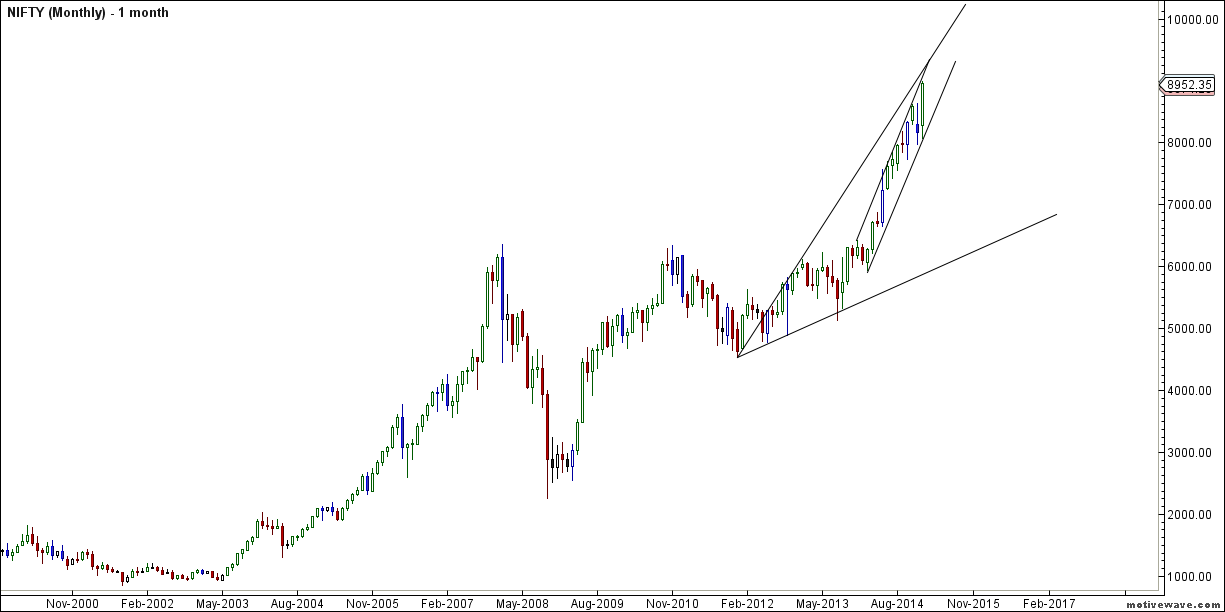
  • Nifty closed the January series with massive  gain of 778 points, In last 15 years big gains were made in January series in  2012 and 2001  As discussed yesterday  Nifty is took support at its HEMA@ 8861 and bulls made nifty rally in last 45 mins.Monthly and Weekly closing today as seen in below chart Nifty is near trendline resistance in Monthly chart so today's price action need to be watched as we get breakout or give some correction from trendline resistance.
nifty monthly

Continue Reading

Thursday, January 29

Century,AB Nuvo and HDFC intraday trading plan

Century Textile

Century Textile555 is trend changer level, closing above 557 stock is heading back to 576. Any close below 555, short term target 540/521.
Intraday traders use below mentioned levels

Buy above 560.3 Tgt..


Continue Reading

Wednesday, January 28

Nifty January Expiry Analysis

FII
  • FII's sold 61.1 K contract of Index Future worth 1300 cores, 69.4 K Long contract were added  by FII's and 1.3 Lakh  short contracts  were added by FII's. Net Open Interest increased  by 2 lakh contract ,so FII's added long and added  majority shorts in index future.So after long time FII's have shorted index futures in huge quantity.
Nifty made new life high today @ 8985  and rising for 9 straight session forming shooting start candlestick , also rallying 1024 points which is also near to 1041 points as discussed in last analysis   Nifty is trading well above its 34 HEMA@ 8874 so till its held bulls are in control.Also today correction we have seen is 111 points...

Continue Reading

Nifty continue to rally for 8 session, Whats next

FII
  • FII's bought 72.7 K contract of Index Future worth 1731 cores, 82.8 K Long contract were added  by FII's and 10 K  short contracts  were added by FII's. Net Open Interest increased  by 92.8 K contract ,so FII's added long in majority and added  partial  shorts in index future.
Nifty made new life high today @ 8925 and the bull run continues with big money flowing by fii's and rising for 8 straight session , as per my perceptive last rally we saw from 7723 to 8627 was 904 points long and took 33 days to complete, the current rally which started from 7961 till 8925 is now 964 points which is more than last rally  and consumed 28 days  and also the maximum rally we have seen..

Continue Reading

Tuesday, January 27

LIC,TVS Motors and Bharat Forge Dravas Box Analysis

LIC Housing

LIC
Intraday traders use below mentioned levels

Buy above 487.5 Tgt..


Continue Reading

Bank Nifty Weekly Analysis for 27-30 Jan

Last week we gave the Chopad level of 19336 Bank Nifty achieved 3 target on upside rewarding trend followers by 520 points.  . Lets analyze how to trade Bank Nifty in coming week.

 Bank Nifty Hourly

Bank Nifty Hourly
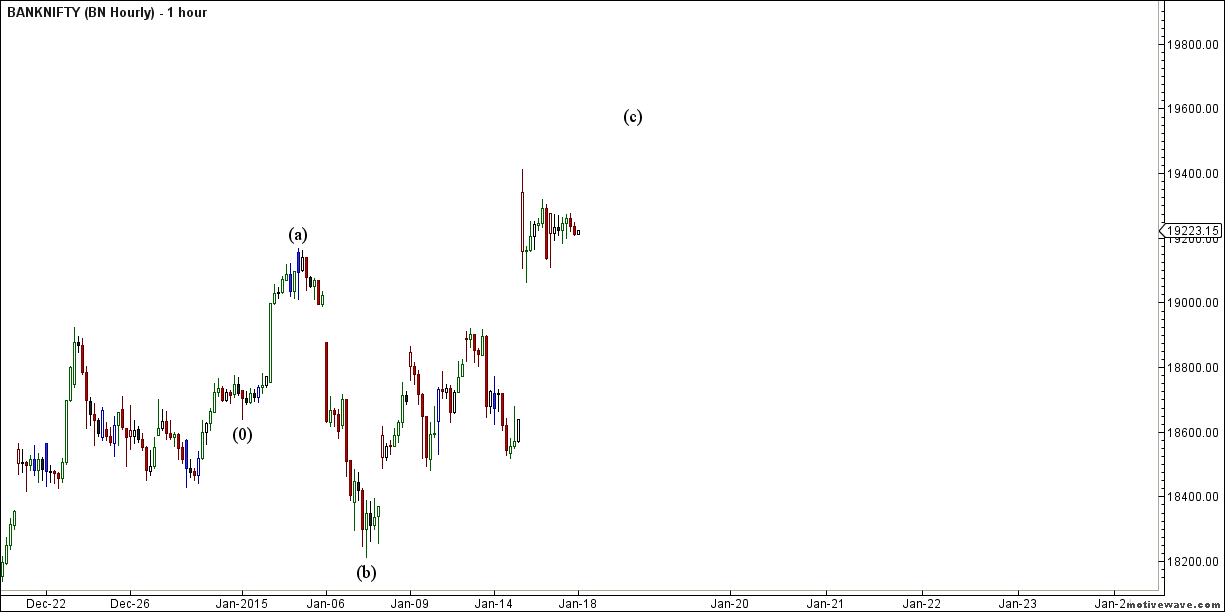
As discussed last week new high came, Now high of 20116 should be watched closing above it can see bank nifty marching towards 20500/20600 Strong support @19900/19800 range.

Bank Nifty Hourly  EW Daily

Bank Nifty Hourly EW
Hourly Elliot wave analysis is shown,20300 will play crucial role next week.

Bank Nifty EW Daily


Continue Reading

Monday, January 26

Bulls and Bear will Fight for 8888, Nifty Weekly Analysis

Last week we gave Chopad Levels  of 8556 Nifty did 3 target  on upside. Bulls are on rampage on Dalal Street, catching many traders on wrong foot and rewarding discipline and trend follower handsomely.  Lets see how to trade nifty in coming week.

 Nifty Hourly Chart

nifty hourly
Nifty Hourly charts has broken above the trendline resistance signalling move towards new high, Any correction new the trendline support will give a good opportunity to go long.

 Nifty Hourly Elliot Wave Chart

Nifty Hourly EW

Continue Reading

Sunday, January 25

Box Metrics for Intraday Traders

One of the best ways of understanding your trading--and your trading psychology--is to collect data on your trading. There are many metrics available for understanding your trading patterns (see the links below), but here are a few unusual metrics that I've found to be especially illuminating:
1) P/L for Your Largest Trades - When you're at your most aggressive, do you make money or lose? Are you aggressive because you see genuine opportunity, or are you aggressive out of frustration?
2) P/L for Your Most Active Trading Days - When you're placing more trades, do you tend to make more money, or do the added trades detract from profitability? Are you trading more because more is going on in the markets, or are you trading more for reasons other than opportunity?
3) P/L as a Function of...

Continue Reading

Saturday, January 24

Nifty rallies 905 points, is more left to rally ?

FII
  • FII's bought 57.4 K contract of Index Future worth 1371 cores, 61 K Long contract were added  by FII's and 3.6 K  short contracts  were added by FII's. Net Open Interest increased  by 64.7 K contract ,so FII's added long in majority and added  partial  shorts in index future.
Nifty made new life high today @ 8866 with another DOJI candlestick formation, as per my perceptive last rally we saw from 7723 to 8627 was 904 points long and took 33 days to complete, the current rally which started from 7961 till 8866 is now 905 points which is equal to last rally  and consumed 27 days  and also the maximum rally we have seen in 1041 points  so still there is room for upside.  Nifty is trading...

Continue Reading

Friday, January 23

Why do gamblers keep going back despite losing most of the time?

Any quick drive through Las Vegas makes it pretty clear who is rolling in the money – the Casinos! Why do gamblers keep going back despite losing most of the time?  Misplaced hope, fantasies about the big win, promising themselves they will walk away when they are up and still winning, and probably the inability to calculate probabilities. These symptoms may sound familiar to new traders who have lost money in the stock market, especially when we were new to trading and had delusions of grandeur about trading theirway to prosperity quickly and easily.
In gambling there are really only two sides to choose to be on, either you are a gambler or you are the house. The gamblers have the long term odds stacked against them. The more they gamble, the more the odds are that they will inevitably lose. The casino has stacked the odds on their side over the  long haul. The more the gambler keeps gambling, the more the odds shift in favor of the casino operator. The more they gamble the greater the chance the gambler will leave empty-handed.

 Profitable traders operate like casinos, with the odds in their favor over the long term. They have learned to trade with historically, back-tested

Continue Reading

BHEL,IDEA and TATA Comm technical analysis

BHEL

BHEL
Any close above 288 stock is heading to 300/322
Intraday traders use below mentioned levels

Buy above 288 Tgt 


Continue Reading

Nifty ready for Big move,FII FnO Data Analysis for 23 Jan

FII
  • FII's bought 44.6 K contract of Index Future worth 901 cores, 35.6  K Long contract were added  by FII's and 9 K  short contracts  were squared off by FII's. Net Open Interest decreased  by 26.6 K contract ,so FII's added long and squared off   shorts in index future in another dull day of trading.
Nifty made new life high today @ 8774 with another DOJI candlestick formation, keeping the suspense on between Bulls and bears , Nifty is trading well above its 34 HEMA@ 8707 so till its held bulls are in control. But one caution sign is momentum has slowed down considerably in past 2 session Reduction in..

Continue Reading

Thursday, January 22

Mario Draghi announced 60 Billion QE

Introductory statement to the press conference
Ladies and gentlemen, the Vice-President and I are very pleased to welcome you to our press conference. Let me wish you all a Happy New Year. I would also like to take this opportunity to welcome Lithuania as the nineteenth country to adopt the euro as its currency. Accordingly, Mr Vasiliauskas, the Chairman of the Board of Lietuvos bankas, became a member of the Governing Council on 1 January 2015. The accession of Lithuania to the euro area on 1 January 2015 triggered a system under which NCB governors take turns holding voting rights on the Governing Council. The details on this rotation system are available on the ECB’s website. We will now report on the outcome of today’s meeting of the Governing Council, which was also attended by the Commission Vice-President, Mr Dombrovskis.
Based on our regular economic and monetary analyses, we conducted a thorough reassessment of the outlook for price developments and of the monetary stimulus achieved. As a result, the Governing Council took the following decisions:
First, it decided to launch an expanded asset purchase programme, encompassing the existing purchase programmes for asset-backed securities and covered bonds. Under this expanded programme, the combined monthly purchases of public and private sector securities will amount to €60 billion. They are intended to be carried out until end-September 2016 and will in any case be conducted until we see a sustained adjustment in the path of inflation which is consistent with our aim of achieving inflation rates below, but close to, 2% over the medium term. In March 2015 the Euro...
Continue Reading

You are in a bull market.When..

You offer your broker a car each morning so he doesn’t need to take the Mumbai local to get to the terminal by 9.15 am.The pink papers are the first to disappear from your lap when you fall asleep on a flight.
Every third executive works through the day with the Moneycontrol site minimized on his computer screen
The excitement in otherwise pin-drop offices is not about Kolkata Knight Riders’s victory but PTC India Financial hitting another circuit.
Old-timers get nostalgic about V P Singh’s 1985 Budget and Manmohan Singh’s game-changing 1991 Budget but conclude ‘this one is different.’
Karvy says the Sensex will hit 100,000 by 2020 and people say ‘That late?’ 
You use the wizened ‘Book your profit’ line in evening conversation and people arch their eyebrows with that elevator look as if your
Continue Reading

Lupin,IRB and Al Bank harmonic trading pattern

LUPIN

Lupin

Any close above 1508 short term target 1542/1563.
Intraday traders use below mentioned levels

Buy above 1488 Tgt...


Continue Reading

Wednesday, January 21

Nifty forms another DOJI, how to trade next move

FII
  • FII's bought 28 K contract of Index Future worth 483 cores, 43.6  K Long contract were added  by FII's and 15.6 K  short contracts  were added by FII's. Net Open Interest increased  by 59.2 K contract ,so FII's added both long and   shorts in index future in a dull day of trading.
Nifty made new life high today @ 8742 with another DOJI candlestick formation, many traders are asking can we see correction in short term, as per my perceptive last rally we saw from 7723 to 8627 was 904 points long and took 33 days to complete, the current rally which started from 7961 till 8742 is just
Continue Reading

ECB's 4 QE Scenarios

After last week's stunning action by the SNB, which according to most was done in anticipation of what will be a substantial QE announcement by the ECB as the last thing the Swiss National Bank wants is to be the primary buyer of what may be up to 1 trillion in fresh minted Euros, it seems that the debate whether the ECB will act next week has become moot.
However, despite various media reports over the past 24 hours about risk-sharing and sovereign security exclusion (i.e., that of Greek Treasurys), as well as speculation that despite it being priced in more than 100%, the ECB may yet again delay the actual announcement especially with what watershed Greek elections following just days after the ECB announcement, the question remains just what format will European QE take. Here, courtesy of Credit Suisse - a bank which was pounded in the past 2 days following the record surge in the CHF - is a preview of the 4 most likely ECB scenarios, as well as a glimpse at what may be the worst possible outcome for Europe: QE itself!
From Credit Suisse:

We consider four potential scenarios for ECB sovereign bond purchases depending on 1) the degree of risk sharing and 2) the size t...

Continue Reading

JSW Steel,Arvind and Exide harmonic pattern analysis

JSW Steel

JSW Steel

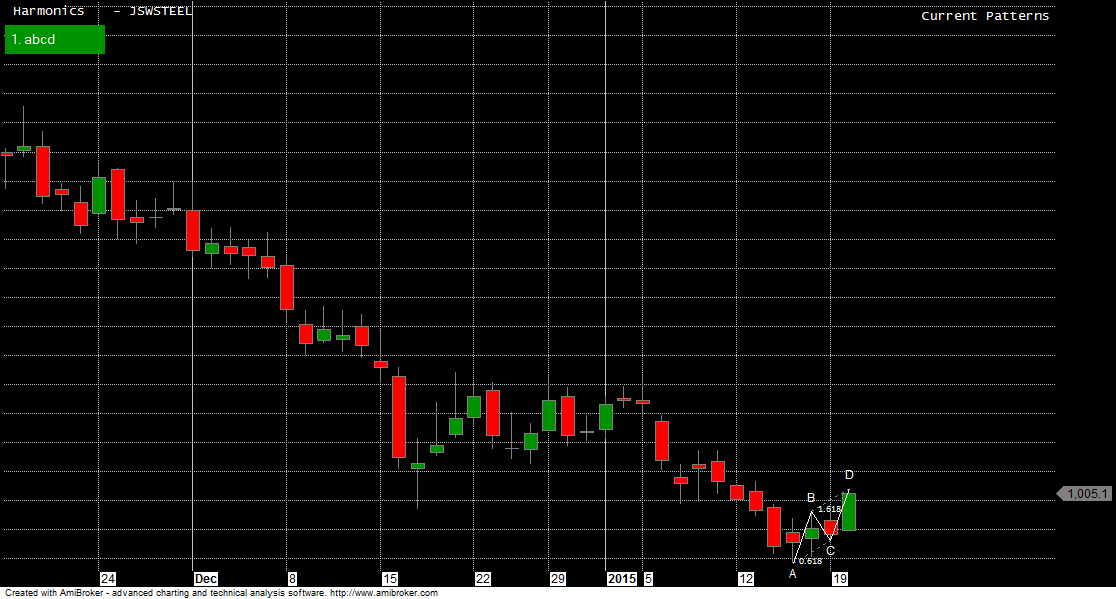
Any close above 1008 stock is heading to 1021/1042/1076.
Intraday traders use below mentioned levels

Buy above 1008 Tgt..


Continue Reading

Nifty at life high, How to trade on 21 Jan

FII
  • FII's bought 83.7 K contract of Index Future worth 1749 cores, 96.9  K Long contract were added  by FII's and 13.2 K  short contracts  were added by FII's. Net Open Interest increased  by 110 K contract ,so FII's added both long and   shorts in index future in a dull day of trading.
Nifty made new life high today @ 8707 as we have been anticipating , As discussed in last analysis  Nifty closed above 8550 suggesting supply is getting observed. As per Hourly chart breakout has happened and new high is round the corner, Also as per gann box analysis Nifty was able to close above  yellow line convincingly so possibility of big rise is round the corner. Expect a trending move in next 2 trading sessions. Also in our Weekly Analysis Gann date should..
Continue Reading

Monday, January 19

FII FnO Data Analysis for 20 Jan

FII
  • FII's bought 1.3 K contract of Index Future worth 56 cores, 1.7  K Long contract were added  by FII's and 0.4 K  short contracts  were added by FII's. Net Open Interest increased  by 2.2 K contract ,so FII's added both long and   shorts in index future in a dull day of trading.
Nifty had a perfect day of consolidation today another DOJI formation, As discussed in last analysis   range of 8526-8545 is important supply zone unable to cross nifty can see pullback to 8400 before marching towards new high.  Nifty closed above 8550 suggesting supply is getting observed. As per Hourly chart breakout has happened and new high is round the corner, Also as per gann box analysis Nifty...
Continue Reading

Sunday, January 18

Bank Nifty Weekly Analysis for 19-23 Jan

Last week we gave the Chopad level of 18686 Bank Nifty achieved 1 target on downside and missed with long entry with gap up . Lets analyze how to trade in coming week.


Bank Nifty Hourly


As discussed last week new high came, Now high of 19410 should be watched closing above it can see bank nifty marching towards 19500/19600 Bank Nifty hourly chart is forming a triangle pattern breakout comes above 18800 for a target of new high and breakdown 18400 for initial target of 18100

Bank Nifty Hourly  EW Daily

Bank Nifty Hourly EW

Continue Reading

Nifty ready to march towards new high,weekly analysis

Last week we gave Chopad Levels  of 8286 Nifty did 3 target  on upside and 1 target on downside. Watch out For ECB, World Economic Forum & China GDP for coming week, expect big round of volatility. Lets see how to trade nifty in coming week.

 Nifty Hourly Chart

nifty hourly
Nifty Hourly charts has broken above the trendline resistance signalling move towards new high, Any correction new the trendline support will give a good opportunity to go long.

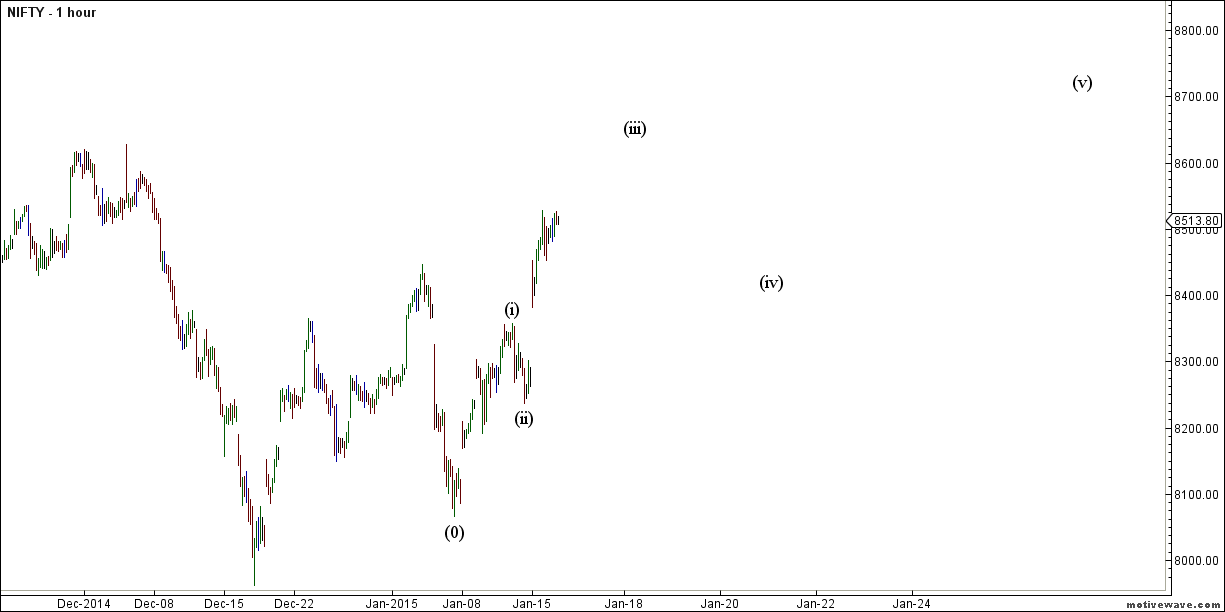
 Nifty Hourly Elliot Wave Chart

Nifty Hourly EW

Continue Reading

Saturday, January 17

How Emotions Affect Your Trading Decisions

It does not matter whether you are reading sophisticated trading books or just browse around online trading forums, almost every trader seems to be aware of the fact that psychology has a big impact on trading performance. However, the way emotions affect trading decisions are very complex and not that obvious at the first glance.
When you think that biting nails, sweating or rubbing your hands greedily are the things that signal emotions while trading, this article will offer some valuable new insights. In the following we explain how to read emotions that affect your trading decisions and how to overcome the negative impacts that arise from emotion caused trading errors.
“Missed it! It had all the entry criteria going for it, but I didn’t like it somehow.”
Especially inexperienced traders or traders who find themselves in losing streaks often act like a stunned deer staring motionlessly into approaching headlights. The surest sign that fear is controlling your trading decisions is that even though you plan a trade and watch the setup unfold in front of you, you still doubt the trade and cannot pull the trigger.
If you notice that you constantly...
Continue Reading

Friday, January 16

FII FnO Data Analysis for 19 Jan

FII
  • FII's sold 37.1 K contract of Index Future worth 848 cores, 34.3  K Long contract were squared  off  by FII's and 3.3 K  short contracts  were added by FII's. Net Open Interest decreased  by 31 K contract ,so FII's added  shorts and squared off   longs in Index futures.
Nifty had a perfect day of consolidation today, range of 8526-8545 is important supply zone unable to cross nifty can see pullback to 8400 before marching towards new high. As per Hourly chart breakout has happened and new high is round the corner, Also as per gann box analysis Nifty today...

Continue Reading

LT,Jubilant Food and BoB Harmonic pattern

LT

LT
Any close above 1597 stock is heading 1631/1652.
Intraday traders use below mentioned levels

Buy above 1580 Tgt


Continue Reading

Thursday, January 15

Nifty Bulls gets R-booster, FII FnO Data Analysis

FII
  • FII's bought 1.69 K contract of Index Future worth 3897 cores, 156  K Long contract were added  by FII's and 12.7 K  short contracts  were squared  off by FII's. Net Open Interest increased  by 144 K contract ,so FII's added  long and squared off   shorts in Index futures.As per FII OI sheet  117k long index contracts reduced on 6th Jan 156 K long contracts got added today so tit for tat for bears.
This is what we discussed last analysis Nifty  saw an intraday correction which got bought into as it found support at its 21/34 HEMA suggesting underlying trend is bullish. Market generally trades volatile in triangle formation before a breakout/breakdown.Best is to trade less or hold on to existing positions. Trending moves should be seen in next 2 days. As per Hourly chart breakout has...

Continue Reading

Wednesday, January 14

Nifty trades volatile in triangle pattern,FII FnO Data

FII
  • FII's bought 9.9 K contract of Index Future worth 178 cores, 4.1  K Long contract were added  by FII's and 5.7 K  short contracts  were squared  off by FII's. Net Open Interest decreased  by 1.6 K contract ,so FII's added  long and squared off   shorts in Index futures.
Nifty  saw an intraday correction which got bought into as it found support at its 21/34 HEMA suggesting underlying trend is bullish. Market generally trades volatile in triangle formation...
Continue Reading

Tuesday, January 13

LT,Tata Global and Century short term technical analysis

LT

LT

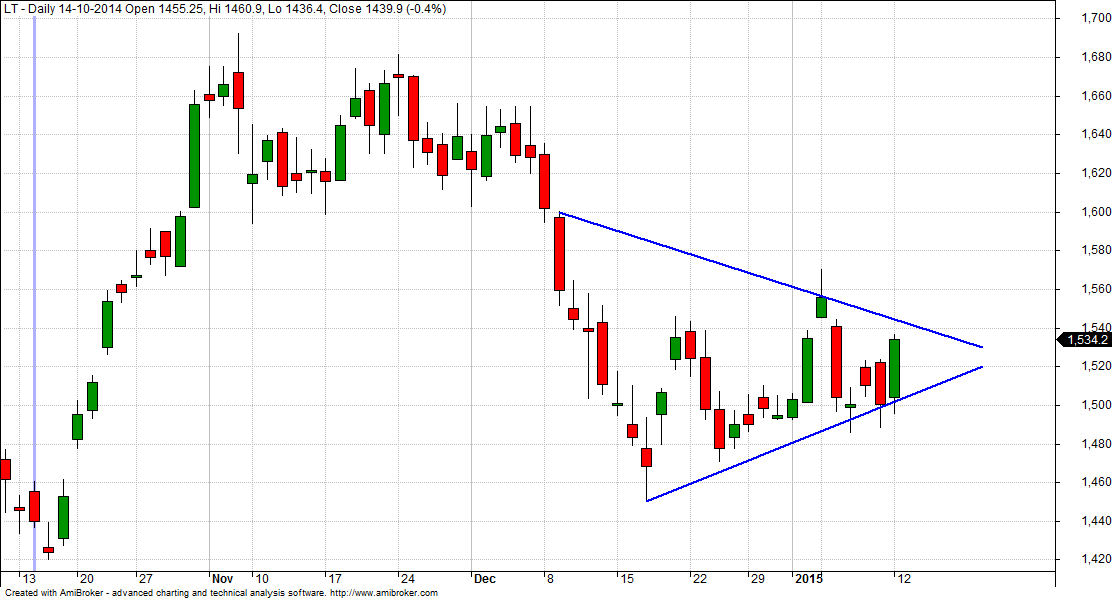
Any close above 1542 stock is heading to 1597/1631.
Intraday traders use below mentioned levels

Buy above 1540 Tgt


Continue Reading

Monday, January 12

Nifty flirts with 50 SMA, FII FnO Data Analysis

FII
  • FII's sold 10.5 K contract of Index Future worth 244 cores, 9.9 K Long contract were added  by FII's and 20.4 K  short contracts  were added  by FII's. Net Open Interest increased  by 30.3 K contract ,so FII's added  both long  shorts in Index futures.
Nifty continued with formation of higher highs and higher lows and also crossed and closed above the 61.8% retracement also near the blue line of gann box and 50 SMA, tomorrow price action is very crucial to suggests can we see gap filling from till8378 and see further upmove till 8450 odd levels where we can triangle...

Continue Reading

You Are A Trader If ..

  • You look at mountain ranges and see 5-wave structures and 61% retracements.

  • You look at the night sky & see a hammer pattern instead of the Big Dipper.

  • You know that Head and Shoulders isn’t referring to a shampoo.
  • You go to the bathroom during market hours and it costs you Rs 50000.

  • You regularly check the Dow Jones price phone when you get up in the middle of the night .

The only cable channel

Continue Reading

Sunday, January 11

Bank Nifty Weekly forecast for 12-16 Jan

Last week we gave the Chopad level of 19076 Bank Nifty achived all 3 targets rewarding Chopad followers with 400+ points. Lets analyze how to trade in coming week


Bank Nifty Hourly

Bank Nifty Hourly
Bank Nifty hourly chart is forming a triangle pattern breakout comes above 18800 for a target of new high and breakdown 18400 for initital target of 18100

Bank Nifty Hourly  EW Daily

Bank Nifty Hourly EW
Hourly Elliot wave analysis is shown,
Continue Reading

Nifty Weekly forecast for 12-16 Jan

Last week we gave Chopad Levels  of 8416 Nifty triggered SL on upside and than rewarded discipline traders with 202 points.  Lets analyze how to trade Nifty in coming week.

 Nifty Hourly Chart

nifty hourly
Nifty Hourly charts moved between both support and resistance line in previous week and is trading above its 21/34 HEMA.8231/8242 is the support zone holding the same nifty can move towards 8400/8450 levels.

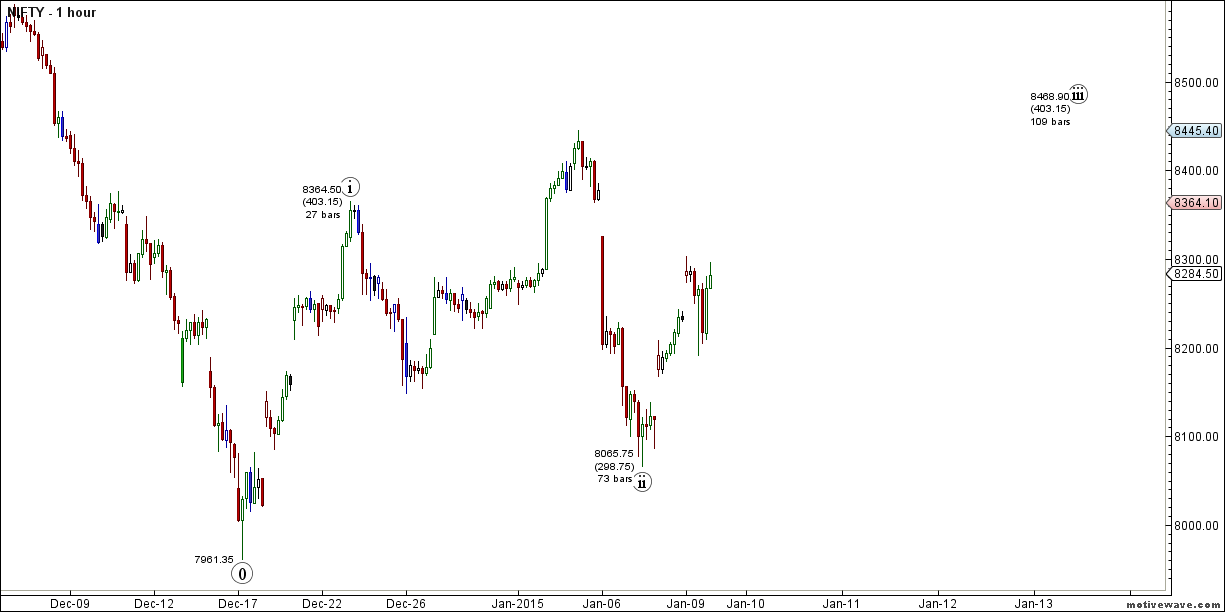
 Nifty Hourly Elliot Wave Chart

Nifty Hourly EW
Elliot wave chart  on Hourly is shown above suggesting..
Continue Reading

Saturday, January 10

Bull Ratio Spread Option Strategy

Bull Ratio Spread:

The Bull Ratio Spread could be called as a variation of the Bull Call Spread. Here we expect the stock to move sideways
to slightly higher.
The Position is created by purchasing a call (preferably At-the-money or slightly Out-of-the-money) and selling more than
one calls at a higher strike price in a ratio of 1:2 or 1:3 (preferably near to the target price) with the same expiration (same
month
).

The strategy is preferred when the upside seems to be decisively capped.

A short time till expiration is generally preferred for the strategy to take advantage of the time decay in the short options
and not give the stock enough time to move very high in price and produce a loss.


  • Maximum Risk: Unlimited on the upside, Limited on the downside to the initial debit paid or none if the position is opened for a credit.

Continue Reading 

Friday, January 9

Nifty ready for Big move, FII FnO Data Analysis

FII
  • FII's sold 6.1 K contract of Index Future worth 62 cores, 17.3 K Long contract were squared off  by FII's and 11.1 K  short contracts  were added  by FII's. Net Open Interest decreased  by 28.4 K contract ,so FII's squared off  both long  shorts in Index futures.
This is what we discussed yesterday Now expect another gap up tomorrow going by historical data and traders should watch 8325-8320 range where next level of resistance lies ie. yeallow line of gann box as shown in below chart. Nifty made exact high near the yeallow line of gann box in volatile session of trade. Now 8300..


Continue Reading

I Bulls Housing,SKS and Just Dial Harmonic Pattern

I Bulls Housing

IB HSG

521 should be watched closing above it stock can move to 555.
Intraday traders use below mentioned levels

Buy above 506 Tgt..


Continue Reading

Thursday, January 8

FII FnO Data Analysis for 09 Jan

FII
  • FII's sold 6.7 K contract of Index Future worth 176 cores, 2.1 K Long contract were squared off  by FII's and 4.5 K  short contracts  were added  by FII's. Net Open Interest increased  by 2.4 K contract ,so FII's squared off  long and added shorts in Index futures.
This is what we discussed yesterday Nifty hourly chart touched the support line and formed a doji candlestick pattern similar to the one @ lows 7961 signalling short term bottom . Tomorrow going by historical data we should see gap up opening, and need to see a rally till 8200/8232 odd levels. Nifty opened with a gap up..

Continue Reading

Wednesday, January 7

Nifty forms Doji pattern, FII FnO Data Analysis

FII
  • FII's sold 11.9 K contract of Index Future worth 216 cores, 23.4 K Long contract were squared off  by FII's and 11.5 K  short contracts  were squared off by FII's. Net Open Interest decreased  by 35 K contract ,so FII's squared off both long and shorts in Index futures.
Nifty hourly chart touched the support line and formed a doji candlestick pattern similar to the one @ lows 7961 signalling short term bottom . Tomorrow going by historical data..

Continue Reading

Tuesday, January 6

Nifty sees biggest fall of 2014 Bull Run, Whats next ?

FII
  • FII's sold 137 K contract of Index Future worth 2817 cores, 117 K Long contract were squared off  by FII's and 20.4 K  short contracts  were added by FII's. Net Open Interest decreased  by 96  K contract ,so FII's squared off big quantity long in Index futures in.
Nifty saw the biggest  decline of current bull market, Biggest falls in  Indian stock market  history saw a one side decline through out the session and is approaching support zone of 8035-8080 where we need to observe the price action. Again I would reiterate on declines like today buy quality stocks for good appreciation. Bullish...


Continue Reading

Biggest falls in Indian stock market history

Here are the biggest falls in the Indian stock market history:
Jan 21, 2008: The Sensex saw its highest ever loss of 1,408 points at the end of the session on Monday.  The Sensex recovered to close at 17,605.40 after it tumbled to the day's low of 16,963.96, on high volatility as investors panicked following weak global cues amid fears of the US recession.
Jan 22, 2008: The Sensex saw its biggest intra-day fall on Tuesday when it hit a low of 15,332, down 2,273 points. However, it recovered losses and closed at a loss of 875 points at 16,730. The Nifty closed at 4,899 at a loss of 310 points. Trading was suspended for one hour at the Bombay Stock Exchange after the benchmark Sensex crashed to a low of 15,576.30 within minutes of opening, crossing the circuit limit of 10 per cent.
May 18, 2006: The Sensex registered a fall of 826 points (6.76 per cent) to close at 11,391, following heavy selling by FIIs, retail investors and a weakness in global markets. The Nifty crashed by 496.50 points (8.70%) points to close at 5,208.80 points.

December 17, 2007
:  A heavy bout of selling in the late noon deals saw the index plunge to a low of 19,177 - down 856 points from the day's open. T

Continue Reading

Monday, January 5

Mistakes Beginners Traders Make - I

Truth be told, when you are new at something it is very easy to make mistakes. Unfortunately, in the Stock  market you will find that almost all new traders make the same mistakes over and over again.
To have a steeper learning curve and gain more from your trades, you need to identify the common mistakes made by beginning traders and find out how to avoid those mistakes.

1. Misreading Charts

It is true that price charts are the primary tools for successful  trading . The main mistake beginners make when reading price charts lies in the identification of time frames.
Traders should always ensure that they are looking at time frames that immediately precede and immediately follow the chosen trade period.
Any other time periods are irrelevant for that particular trade period and should not form the main reason for making trade decisions.

2. Trading From Fancy Tools


Continue Reading 

Arvind,Syndicate Bank and Rel Cap technical analysis

Arvind

Arvind

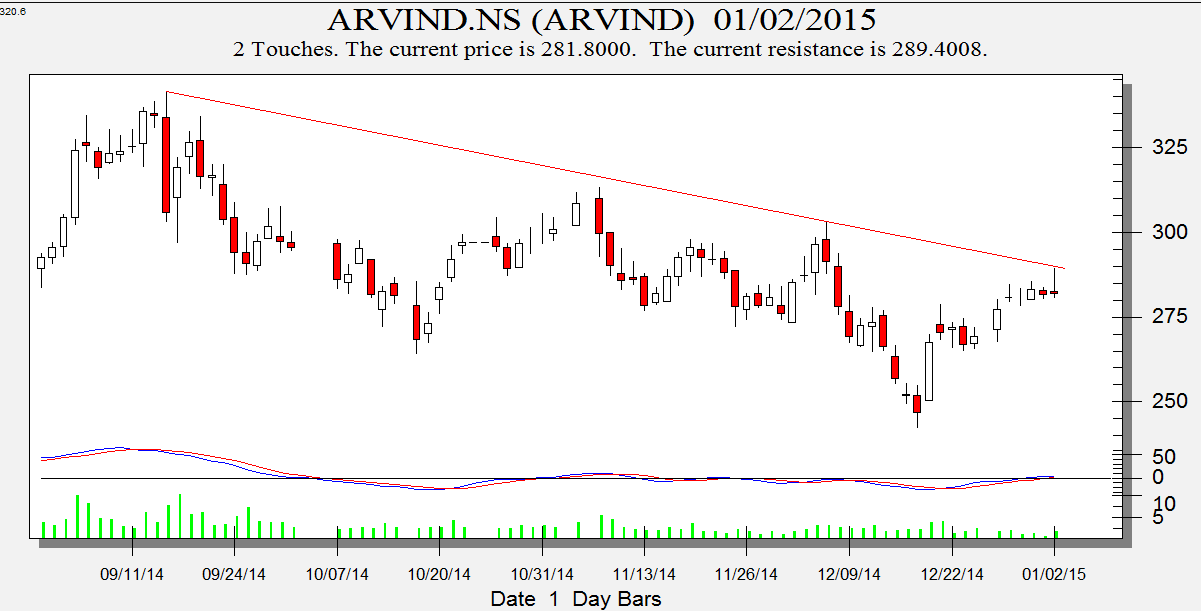
Positional traders should look for close above 288 for short term target of 300/321.

Intraday Traders use the below mentioned levels

Buy above 284 Tgt..


Continue Reading

Sunday, January 4

Bank Nifty Weekly Technical Analysis

Bank Nifty Hourly

Bank Nifty Hourly
Bank Nifty hourly chart will breakout above 19100 for target of 19800/20000.

Bank Nifty Hourly  EW Daily

Bank Nifty Hourly EW
Hourly Elliot wave analysis is shown,19166 will play crucial role next week.

Bank Nifty EW Daily


Continue Reading

Nifty Weekly Technical Analysis

Last week we did not share any weekly analysis, As per Historical data Important Swing low and high are formed in 1 week of January so keep a close eye on Nifty price action in coming week. Infosys results will be declared on 9 Jan, this time the timings have changed to 12:30 PM. Lets analyze how to trade Nifty in coming week.

 Nifty Hourly Chart

nifty hourly
Nifty Hourly charts is approaching its trendline resistance @8410/420 crossing the same the up move will continue till 8484/8530 else we might /see pullback again towards 8350/8280 odd levels.

 Nifty Hourly Elliot Wave Chart


Continue Reading

Saturday, January 3

Gann trend following techniques

In Continuation with Previous Article W.D. Gann Trading Techniques – I
 Trend and trend following techniques: In fast advancing markets, in the last stage of the campaign, reactions get smaller as stocks work to higher level, until the final run has ended. Then comes a sharp reaction and a reversal in the trend. Same happens in the bear market. Once you are convinced that a trend is in force, do not wait too long to go with the trade. Early in the trend buy/sell a stock which is already strong/weak.
  • Fast moves generally come from bear market bottoms.
  • These moves usually run three weeks up, then move sideways three to five more weeks, and then accelerate followed by another sideways movement.
  • Under fast moves the first signal to trend change is overbalance i.e. reaction gets larger compared to the earlier ones, specially in the fifth wave. Watch the changes in momentum of price - is the market/stock gaining less points in more time? If the market is trending up, then it should go up more time than it goes down. And vice versa.
Continue Reading

Bulls back with bang, FII FnO Data Analysis

FII
  • FII's bought 19.8 K contract of Index Future worth 453 cores, 18.2 K Long contract were added by FII's and 1.6 K short contracts  were added by FII's. Net Open Interest increased  by 16.6 K contract ,so FII's added majority long in Index futures in.
As discussed in yesterday analysis  Nifty is near very crucial point as per Ichimoku Cloud and big move is round the corner. Also 20/50 SMA are converging any break above 8310 can see explosive move on upside and break of 8214 can see move below 8174/8120. Nifty gave the explosive move today and 


Continue Reading

Thursday, January 1

FII FnO Data Analysis for 02 Jan

FII
  • FII's sold 2.6 K contract of Index Future worth 28 cores, 2.2 K Long contract were added by FII's and 4.9 K short contracts  were added by FII's. Net Open Interest increased  by 7.1 K contract ,so FII's added majority shorts in Index futures in volumes trade today.
 Nifty is near very crucial point as per Ichimoku Cloud and big move is round the corner. Also 20/50 SMA are converging any break above 8310 can see explosive move on upside and break...


Continue Reading