Tuesday, June 30
MACD Divergence signals
MACD Divergence Signals.
There are 3 types of Bullish signals that can come from the MACD Indicator. The three types are:
a. Positive Divergences
b. Bullish Moving Average Crossovers
c. Bullish Centerline Crossovers, and ...
There are 3 types of Bearish signals that can come from the MACD Indicator. The three types are:
a. Negative Divergences
b. Bearish Moving Average Crossovers
c. Bearish Centerline Crossovers
A Positive MACD Divergence is a condition that occurs when the underlying security moves down or sideways and the MACD does the opposite by rising or making a higher/low. Of the three kinds of MACD Bullish signals, the Positive Divergence signal is the least common but typically the most reliable signal. Bullish MACD Divergences are regarded as an important "bullish" sign by technical analysts.
Conversely, a Negative MACD Divergence is a condition that occurs when the underlying security moves up or sideways and the MACD does the opposite by declining or making a lower/high. Of the three kinds of MACD Bearish signals, the Negative Divergence signal is the least common but typically the most reliable signal. Bearish MACD Divergences are regarded as an important "warning" sign by technical analysts.
Now look at Nasdaq Charts negative divergene is easily visible.
Sunday, June 28
Weekly Stock Picks for trading
Nifty resumed its weekly Uptrend after closing marginally in greem.This week will see more volatile moves as Budget is on 6 and railway budget will be presented on 3rd.So i can make 2 scenarios
1. Nifty fulfills it's H&S tgt of 4510 and marches ahead.I have no inkling what will happen once 4510 is crossed.We have to revisit what the Indicators and oscillators are showing at that point of time.FII who were pulling out the money have now are showing an uptick on last friday.
2. If nifty breaks and closes below 4200 we are down to 4000 odd levels. Global markets will also play a good role.
Nifty Weekly Charts
Stock Specific Trading Ideas
Infosys a move above 1849 levels can propel it to 1900 in the coming week keep 1% as ur Sl fr intraday
Larsen is showing good strength can see some 1650-1675 levels sl 1580
Axis Bank Stock is showing some real strength and a highest weekly closing and hit a 52 week high last friday.Momentum can drive it to 833 848 875 levels support is at 791 and 764
Cadilla Healtcare Good move with vols on Weekly Chart chart can be bought on dips for a tgt of 414 434 sl 360
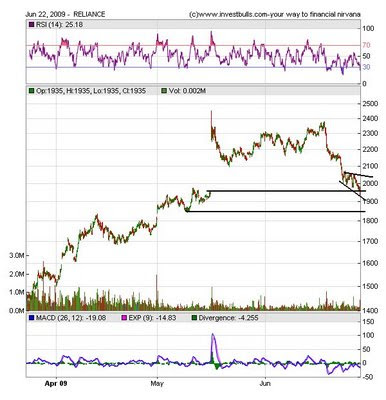
Reliance is again subdued on daily charts 2068 and a weekly closing above 2105 will give strength to stock
ICICI only above 780 will give strength
I would not be able to update chat box on Monday as i am out of Town Will be back on Tuesday
Regards,
Bramesh
Nifty Technical Weekly Charts

Hi All,
Nifty is forming a Bullish Head and shoulder pattern which is giving a tgt of 4510 in near term.Having said that market as we have already seen a pre budget correction a small pre budget rally can take us to the 4510 levels
As far as i am concerned we are in corrective rally Top we made was 4693 and bottom we made was 4142
So 50% Retracement comes at 4417 61.8% 4482 so these 2 levels must be watched very closely.
For the coming week, the Pivot is 4300 and holding the same it has 4458(R1) & 4541(R2) & 4698(R3). Breaking of 4300, may lead to 4218(S1) & 4060(S2) 3977(S3) & .
Wednesday, June 24
Tuesday, June 23
Nifty forming ascending triangle on 15 mins charts

If Nifty holds today lows and we can see positive global cues we can see 4450 in 2-3 days
Resistance:4297.45 4344.15
Support:4173 4096
For Camarilla Pivot Points
L3:4201.18 L4:4167.01
H3:4269.51 H4:4303.68
If L3 breaks go short for a tgtforf 4167
and if H3 breaks go long for a tgt for 4303

Another chart came to conclusion after a discussion with my friend channel should break for more further upmoves.
Monday, June 22
Sunday, June 21
Trading Ideas for Week Stating 22 June
Rcom strong support at 295 if dips there can buy with rs 3 sl for 311 325 Levels
SBIN excellent support at 1600 Cmp is 1725 Resistance is at 1754 1783 1823 while support is at 1686 1647 1618 and 1600
Suzlon showing good strength if 115.2 is crossed can see 119 and 125 levels and support is at 104 98 92
India Infoline buy if 123.50 is breaked and sustained for 125 128 132 as tgts
PNB keep a sl of 626 can see 690
TATA Communication has formed multiple bottom at 461-463 levels if market sustains can see 476 490 and 512 levels
LT buy with sl of 1450 tgt 1550 1565
Hindalco can be bought for a tgt of 105 110
For all the calls above if Nifty breaks 4200 exit all of them.
Nifty Weekly View for Week starting 22 June
 Nifty as said in previous week analysis jas formed a Doji pattern which means a trend reversal is on cards. Nifty closed below previous week low of 4380 a sign of trend reversal but more confirmation will be required will keep u all updated.
And after week we are down 6% on Nifty so whats next as seen from the Weekly Charts we have a formed a bearish engulfing pattern,
But Bulls have not given up the fight uptil now and we have taken support at 34 EMA and bounced from there.
This week we can see a bounce till 4413-4420 Levls and these levels should be used to trim yu long positions and create postional shorts as if Weekly low of 4206is broekn we are down to 4150 4000 3950 levels as we need to fill the gap we have created. On the long side if suppose 4413-4420 is broken and we close above that we may head towards 4500-4600 levels which i consider a very rare possiblity.
Nifty Weekly support is at 4206 4116 4090
Nifty Weekly rsesistance is at 4385 4415 4540
Thursday, June 18
Nifty Possible Moves for Tommorow

Well after 2 days of relentless selling and turning each and evey analyst to give some bearish move i have some ray of light for ppl who went long in dying hours of trade
As seen from the charts if we move and sustains above 4270-80 range tommorw than possibly we are haeading towards 4343 and 4400 Levels and if the todays low of 4422 breaks than 4190 4150 4100 and 4050 are support not shown in Charts
Tuesday, June 16
Today Blog got it's 26000 Hit

Hi All,
Thanks for the immense support which all the visitors and Blog followers have given for the Blog to Reach 26K mark (Which is a dream number and an elusive one to me ) in a short span of time.
I would try to work with more dedication and commitment as ever before and try to give good food for thought to my visitors and i except the same commitment from my readers and do criticize me with your comments as that will help me to excel and give good service to all of the fellas.
Regards,
Bramesh
VIX and S&P
 Many technical analysts were alarmed yesterday because the VIX closed at 30.81.
 Why the concern?
Because over 30 is currently considered a reading that has been associated with past stock market drops.
One day does not make a trend, so more than one day would be required to confirm a trend change.
At the same time, the S&P 500 dropped yesterday, but it still held its trend line. So while risk levels increased yesterday, a correction will need more market data for any kind of confirmation.
Sometimes, there is anecdotal
Yesterday's VIX chart is aboveMonday, June 15
Three Black Crows Candlestick Formation on BHEL Charts
 A bearish reversal pattern consisting of three consecutive long black bodies where each day closes at or near its low and opens within the body of the previous day.
So this is about the Definition Now lets see BHEL Charts and dig it further
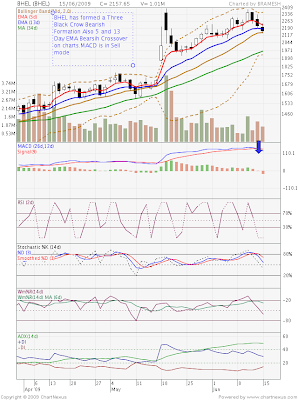 Now as seen on BHEL charts Three Black Crows BHEL has formed a Three Black Crow Bearish Formation Also 5 and 13 Day EMA Bearish Crossover on charts.MACD is in Sell mode
Support is at 2121 2098 2046
Resistance is at 2216 2274 2314
Sunday, June 14
POSITIVE APRIL IIP – ARRIVAL OF THE GREEN SHOOTS!
As expected by all, the much awaited improvement finally came in! March 09’ might well have been the last of the contraction that we have seen. April IIP numbers does indicate a cause for some celebration.
April IIP was in the positive at 1.4% v/s the contraction of 2.3% in March. Electricity continued to grow and in April it was up 7.1% (YoY) despite a fall in hydel power. Mining was up 3.8%, manufacturing output just about managed to nudge itself into the positive territory at 0.7%. Capital goods output was down 1.3% and that seems a kind of an anomaly, as there is growth all around. Maybe this is a blip and would correct itself in the coming month.
Now a bounce back is expected in the months to come in fiscal 2009-2010. Industrial production in the first month of 2009-10 has begun on a positive note. The effect of the fiscal stimulus on the domestic economy will be seen in the coming IIP reports. The increased benefits of NREGS and full implementation of Sixth Pay Commission by states will also be felt in coming months. With inventory now under control and Govt spending also expected to step up further, looks like the turnaround is here to stay.
This means that we are through with the contraction. We are basing this on a couple of reasons. One is that infrastructure index has done quite well for April. Secondly, from January onwards we have been seeing an upturn in demand in a few sectors and over a period of time, it is likely that this improvement in demand will spread to other sectors also. We also have to remember that elections have just finished and that has made the system quite cash flush and to a large extent, the rural demand, which are talking about is also a reflection of this increased spread during the elections.
There is now no doubt that the companies have worked through most of the piled up inventories. So possibly we will now see stabilization in output numbers in this quarter and from next quarter. This would mean a more sustained positive IIP.
Yet for a sustained recovery our exports need to perk up. Exports fell by a whopping 33% in April 09’, the most in at least 14 years. Revival of export demand and growth in consumption is expected only after the second half of FY10. Until then, while industrial production may hover in the positive territory, a decisive upturn would take some more time.
Nifty Weekly Ideas and Trading Tips
Hope you all had a wonderful Week.Nifty had a dream run going down by 157 points on Monday and than touching a high of 4703 on Future on Friday before surrendering its gains inspite of good iip Numbers.So what does it suggest and coming on Sensex, Sensex kept up the façade of an indomitable uptrend even as the broader market succumbed to selling pressure last week. BSE Midcap Index ended 3 per cent lower while BSE Smallcap Index was down 7 per cent.Well as far as i can understand Technical correction which was overdue is offing in coming Weeks and may be we can test the recent low of 4365 and go below that.
If one remmber on Jan 8 2008 the small caps went on LC and almost after 2 weeks we had a huge correction is markets. Just a food for thought,Now going by cuurect sceanrio Small caps Index was down by 7% WoW basis.So it s up to u to ponder.
Nuke war warning between the Korean countries can also add fuel to fire on downside.
Technically Speaking Markets are looking overbought on Weekly Basis and we are seeing Negative divergence on RSI and a long Legged Doji on the Weekly charts indicates that mometum is slowing down Markets are looking tried and they need a rest before moving futrhur.
Levels to be watched out for on Weekly Basis Click and check the Charts
Intra day levels will be posted on the BLog Chat Box everyday and should be traded according to that
Stock Specific
IGL Buy at cmp tgt 162 Sl 143
Jet Airways Sell at Cmp for a tgt of 265 sl 302
SBIN Reistance at 1691 and 1758 Should be shorted newr resistance for a tgt of 1600 1563
BHEL LT Reliance Looks overvalued can see bear brunt in coming sessions
Option call:Buy 4300 PE around 30-35 levels for a target of 50,70,100
Regards,
Bramesh
Thursday, June 11
Technical Analysis of Reliance EOD charts
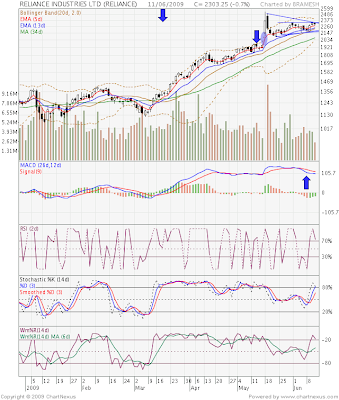
Reliance the Index Heavyweight and the Poster Boy is truck in a Channel from 2128 to 2330 and currently trading at the top end of channel.Prudent trade will be to take long only above 2350 for a target of 2400 2478 2520
and if suppose if 2087-2094 breaks on down side than we have a huge gap to fill from 2087 to 1963 as shown in charts.
SO better trade with levels and njoy he ride on both upside and downside which ever comes.
MACD is showing a Bearish movements and RSI is slightly overbought on Charts.
Pivots for tomorrows Trade
Resistance 2324 2346 2367
Supports 2282 2261 2239
Tuesday, June 9
Monday, June 8
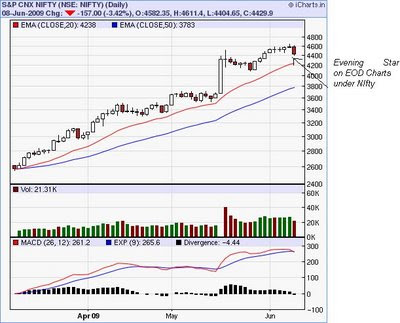
Evening Star in Nifty EOD Charts

Nifty EOD Daily charts are showing Evening Star formation.
Now first lets see what exactly is this Evening Star and its implication
1. The first bar is a large white candlestick located within an uptrend.
2. The middle bar is a small-bodied candle (red or white) that closes above the first white bar.
3. The last bar is a large red candle that opens below the middle candle and closes near the center of the first bar's body.
As shown by the chart above, this pattern is used by traders as an early indication that the uptrend is about to reverse.
Now coming to Nifty EOD charts it is not exactly an Evening Star but can be considered
On Thursday we can see in charts we had a up move and after that a Gravestone Doji on friday which was giving an indication of downfall and a large Red candle today. Lets see how coming week spans out.
Nifty Technical View for 08 June

Nifty at last Broke the scared levels of 4444-4448 and that too with a bang made a low of 4409 which shows the bear power and as discussed in the Below past that it is appearing that it is buy on Dips strategy but today it became exit and wait strategy.
Lets figure out what can happens next can we bounce back with a bang tomorrow or we will carry on with this correction as per my view second looks more possible as Dow is bleeding today down 115 as i am writing the post.As told before last hal hour is pretty adventurous in Dow.There are no +ve div in 5 minute charts.
Now talking About support and Resistance
Support for Nifty comes at 4404.65 4352 4325 4305
Resistance for Nifty comes at 4456 4483 4496 4503 4532 4562
Sunday, June 7
Nifty Weekly View and Trading Ideas
Hi all,
Nifty had a made an History by posting 13 Weeks of gain.Now whats goes up needs to come down an old age adage.So we should not get carried away by this rise and we should book profits at each rise for now.As of now still i am bit circumspect of this rally and believes it as a bear market rally.
Since last one week, you have already seen down moves of about 100 points and then a quick bounce back up on 3 to 4 occasions, which will make one believe, that it will bounce back once again making a new high, but very soon it will not and will catch everyone unaware. As this rally catch all of us on back foot the same will happen on the downside. Market is highly leveraged and a slight bad news flow and a break of 4451 where we have formed triple bottom can lead us to 4380 4320 levels.
It was a relatively sedate week in global equity markets.Dow and S&P are showing negative divergence on daily charts,Dow has resistance at 8000 and Hangseng has reached 38.2% Retracement of the high in 2007 to the low in oct.
Nifty Weekly
Resistance 4650 4720 4770
Supports 4551 4484 4430
Stock Specific:
Unitech Looks quiet overbought on daily and weekly charts Can be shorted till 105-108 Sl 111
tgt of 99 93 89
United phosphorus buy at 166 sl 158 tgt 175
Hindalco buy above 94.5 for a tgt of 96 98 Intra day call and buy this stock in correction also
Infosys Technology has moaved after 4 weeks of congestion from 1490-1620 can be bought around 1670-1700 for a tgt of 1800
BPCL buy around cmp for a tgt of 500 sl 452 Crude will cool of in coming session which will be beneficial for the stock.
Option call buy 4500 put around 110-120 for a 30-50% upside and if nifty crosses 4650 buy 4800 CE
Regards,
Bramesh
Saturday, June 6
Divergences in Technical Analysis

Often times, you may have noticed that we point out market conditions that are showing a "Divergence".
What are divergences and why are they important?
First ... a divergence usually involves the direction of an asset's price versus the direction of an indicator that suddenly starts to move in an opposite direction.
Market technicians consider a divergence to be either positive or negative. In both cases, these divergences are considered as warning signs, or the possibility of a major price shift being around the corner.
A positive divergence occurs when the price of a security makes a new low while an indicator starts to move higher. A negative divergence occurs when the price of the security makes a new high while the indicator starts to move lower. (Since an inverse indicator like the VIX already moves in the opposite direction to be in consensus, moving in the same direction for the VIX would be a divergence.)
Bottom line, a divergence means that something is not quite right. It's a warning sign that can turn into a reversal of the market's direction. Sometimes, the divergence dissipates and everything returns to normal. Other times, the divergence was a warning of an impending change of direction in the market.
You may recall our concern about the VIX on Tuesday. At that time we said, " On yesterday's (Monday's) strong up day, the VIX should have moved lower (the VIX moves opposite to the stock market). Instead, the VIX closed higher."
For the VIX versus the S&P 500, this was a negative divergence. For the VIX it was an abnormal behavior.
What has happened to the VIX since Tuesday ... better yet, what has happened in the past 10 days?
If you look at the two black arrows I drew on the chart below, you have your answer. The S&P 500 moved higher in the past 10 days. Since the VIX (Volatility Index) moves opposite to the S&P 500, then the VIX should have moved lower.
Upon inspection, you can see that the VIX did not do that, instead ... it moved UP during the last 10 days. This was a negative divergence. There was another negative issue about the VIX's level yesterday ... can you spot it?
The answer: The VIX closed above a 7 month resistance line. That is a negative. It actually has been hugging the line, so it has not gone out of control yet. None-the-less, it is a warning sign that one should proceed with caution because "something is going on".
This was the S&P Perpective.Now turning the eyes to our Own market and look at what picture is emerging.As u can see from the Picture below when using the ROC as an indicator it is showing Negative divergence on EOD charts
Warms Regards,
Bramesh
09985711341
Thursday, June 4
Managment Lessons from fall of General Motor
The fall of GM is symbolic of the current times in which
Now that GM has filed for bankruptcy, it’s easier to see what went wrong with the company. As the saying goes, one should learn from mistakes. For Indian car makers, a lesson to keep in mind is the mistakes which GM made. By looking at what exactly went wrong, we can see what Indian car manufacturers can avoid doing.
What went wrong with GM?
1: The company just hoped that it would be able to live forever on its brand loyalty. It felt that people would just keep on buying their same cars even when things all around GM were changing rapidly. Losing sight of what people actually wanted led to this end of an era.
2: GM made SUV which were basically gas guzzlers. When price of fuel was at reasonable levels, it was ok to have an SUV but over a period of time, with fuel prices soaring and global warming becoming a reality, people changed their preference to a more ‘green’ and fuel efficient car. People wanted a car which would give them better mileage and this important indicator, of having more fuel efficient cars was also missed by GM. This is where
3: The designs of GM just simply did not appeal. GM did keep up with new models but with competition from the likes of Honda and
4: The economic turbulence and then the fall in demand also just added on to the already brimming cup of woes. With demand falling sharply, costs became untenable. And the most significant cost, which was affecting the costing of the cars was the burgeoning labour bill. Labour cost was almost $2,360 per car, which was $800 more than Ford's and $500 more than Chrysler's.
5: Its sheer size was also its nemesis. It grew so big, it lost touch with its customers, especially the new ones. Those who grew up with GM knew what it was but those who saw their father’s with GM cars, wanted no part of it. The median ages for buyers of GM's Chevrolet was 45, it was 55 for Oldsmobile and 60 for Buick. As against this, the new generation preferred the Japanese cars and their age ranged from 35 to 40. When an elephant walks with its head up, it is sure to miss the pitfalls and thus get trapped.
6: The biggest lesson for all car makers from this fall of GM – always listen to the dealers. The showrooms are the true indicators of what customers actually want. GM failed to do that. Though it kept on giving new models, these were versions of the older ones and not what its competitors were giving. The floor manger in the car showroom can give one the exact idea of how well or badly the car is doing.
7: Companies need to change with time, especially the way in which the top management functions. GM ran the company the in the same way for 70 years, following the same rules laid down in the memo by its founder. Also the arrogance of success was so high, they just failed to adapt to fundamental changes in the industry.
Wednesday, June 3
Nifty and Trading Ideas for 03-jun-09
Lets trade with Levels.Now we have seen 2 Doji consequently on Nifty So what does it signify stalemate bulls and bears and buying is dying and week hands that have entered the markets should be shrugged off So till when market could fall
As the time i am writing this post Dow is down -119 and lets see how it closes coz i have seen dow last 30 mins are very dramatic and full of suspense like an action flim :) fingers crossed.
Levels to be watched
Nifty has broken the down channel and 4480 and 4451 are the levels to be watched.
Nifty support 4477 4451 4431 and 4384 resistance is at 4577 4620 4650
Reliance the poster boy has closed below its 5 Ema at 2255 Support are emerging at 2211 2174 which is 13 Ema also resistance is at 2293 and 2341
Tuesday, June 2
Quick Check on Calls Given for Short Term
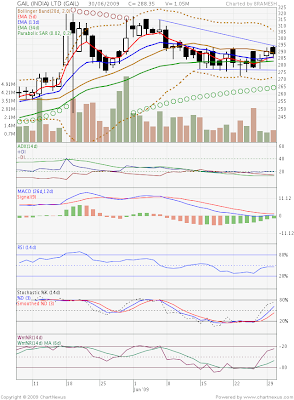
Gail Charts
Escorts Breaches Both tgt reaches 85 today and hold on for rs 100
Escorts Charts
Regards,
Bramesh
Stocks Will Fall 37% or Gold Will Rally 60%
How’s this for a bubble?
I’m talking about the bubble in “investing in stocks.” Never before have so many Americans done this. It gave us one of the biggest bull markets in stock history: a mega-18 years run from 1982 to 2000. But it also means that stocks have got a long ways to fall to get back in line with their historic relationships to other asset classes.
A lot of commentators talk about how gold is near an all-time high and that stocks have fallen 50%, making them cheap again. However from a long-term perspective, gold and stocks are nowhere near their normal relationship.
According to Dr Marc Faber, editor of the Gloom Boom Doom Report, gold and stocks move in distinctive long-term trends. Over the last 110 years, these trends has staged six major phases:
- 1900-1929: stocks outperform gold
- 1929-1932: gold outperforms stocks
- 1932-1966: stocks outperform gold
- 1966-1980: gold outperforms stocks
- 1980-2000: stocks outperform gold
- 2000-???: gold outperforms stocks
During the last bull market in gold, the precious metal rose 2,329% from a low of $35 in 1970 to a high of $850 in 1980. However, during that time, there was a period of 18 months in which gold fell nearly 50%.
by: Graham Summers June 02, 2009
