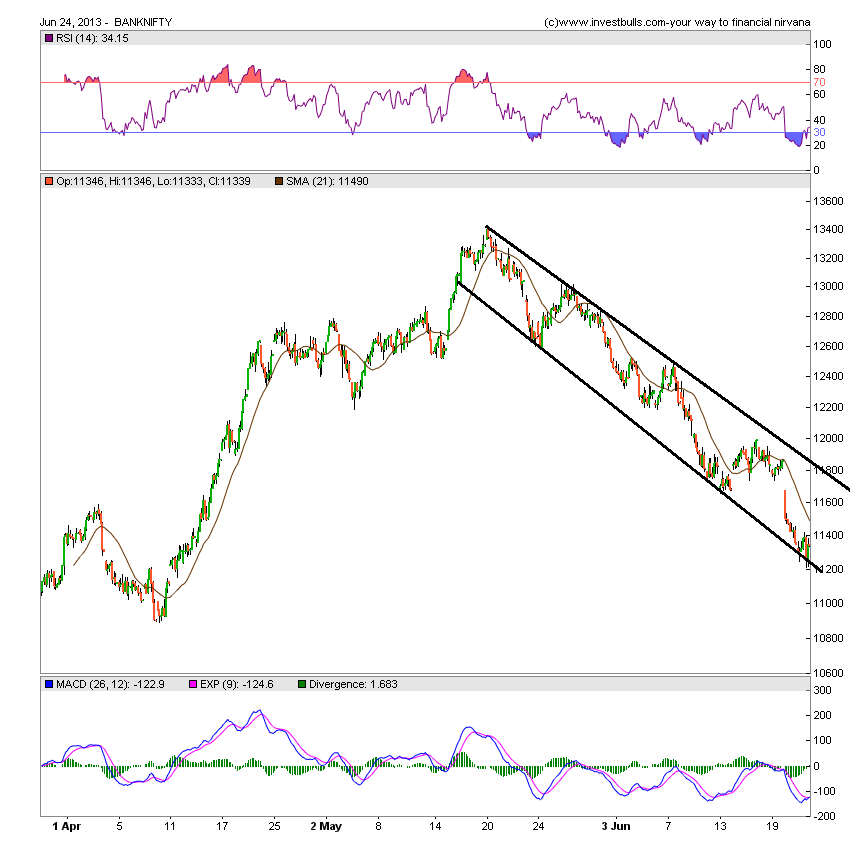
Nifty Technical forecast for July Month
Last week we gave Trend Deciding level as 5720 Nifty achieved
3 weekly targets on upside made exact high at 3 weekly target of 5852
:) and 2 target achieved on downside.Hope traders are able to mint money
on both sides. This is what i have said last week analysis Its
has been observed for historical data Nifty rallies swiftly after 5
week of correction and this being an expiry week. So traders carrying
short are advised to book out shorts and go long above Weekly trend
deciding level. I have been an advocate of booking shorts from past 2-3 sessions and hope no traders reading analysis were stuck up with shorts.

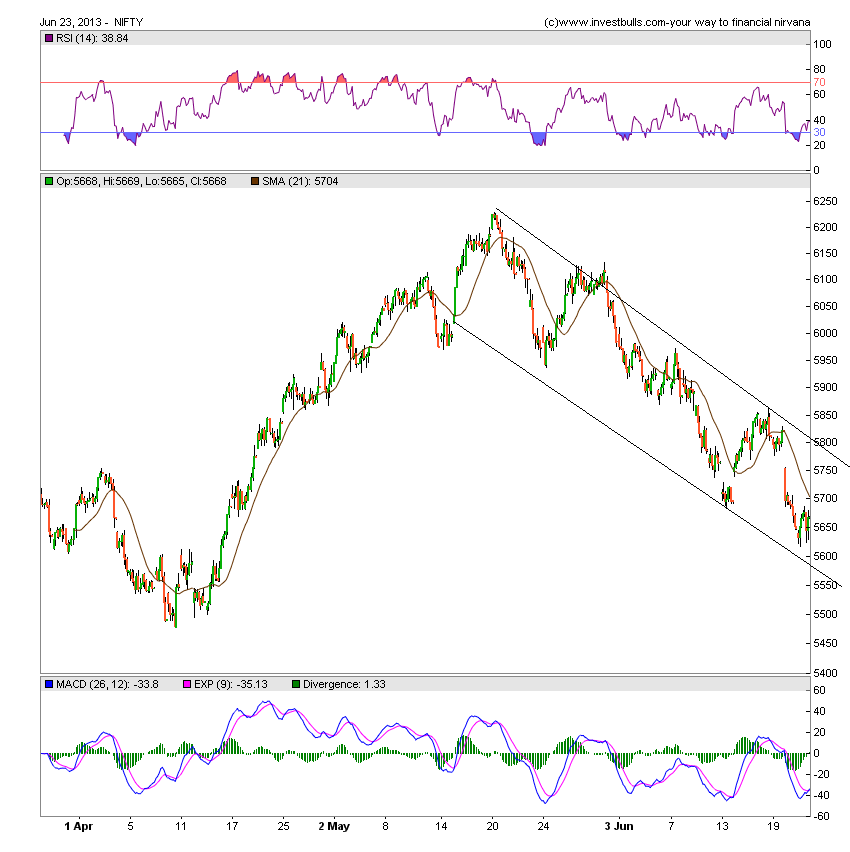
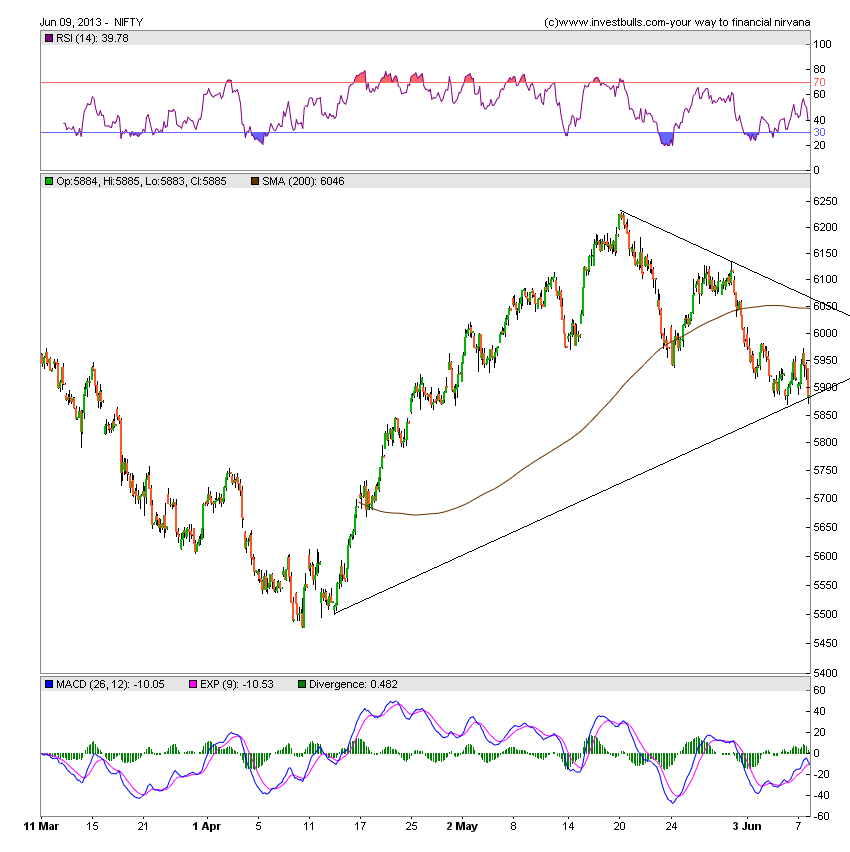
Nifty Hourly charts is now trading in a trendline crossover zone..
Continue Reading
Nifty Hourly Chart

Nifty Hourly charts is now trading in a trendline crossover zone..
Continue Reading
posted by Bramesh at
12:30 PM
0 Comments
![]()
![]()