Thursday, October 30
Wednesday, October 29
Bulls rule Dalal Street in most hated rally, FII FnO Analysis for October Expiry

- FII's bought 52.9 K contract of Index Future worth 2166 cores, 45 K Long contract were added by FII's and 7.8 K short contracts were squared off by FII's. Net Open Interest increased by 37.2 K contract , so FII added highest amount of long in index futures in October series.
Tuesday, October 28
Nifty ready for Big move,FII FnO Data Analysis

- FII's bought 14.2 K contract of Index Future worth 592 cores, 41.5 K Long contract were added by FII's and 27.3 K short contracts were added by FII's. Net Open Interest increased by 68.9 K contract , so FII added long in index futures but are adding shorts.
Continue Reading
FII FnO Data Analysis for 28 Oct

- FII's bought 16.8 K contract of Index Future worth 680 cores, 23.7 K Long contract were added by FII's and 6.8 K short contracts were added by FII's. Net Open Interest increased by 30.6 K contract , so FII added long in index futures but are adding shorts.
- Nifty after 5 days of rise took a breather structure is still bullish till it do not close below the green line in the gann box.

Nifty Future October Open Interest Volume..
Monday, October 27
Bank Nifty ripe for consolidation, Weekly analysis
Last week we gave Nifty Chopad level of 16086 Bank
Nifty opened with big gap up made low of 16157 and marched higher made
a fresh all time high,As we have FOMC meeting and expiry lying ahead so
trades should trade caution as wild moves are bound to come in bank
nifty. Lets analyze how to trade Bank Nifty in coming week.

This sis what we discussed in last analysis Bank Nifty hourly charts are trading in contracting triangle, triangle breakout comes above 15150, if broken and closed over it bank nifty is heading to new high towards 16309 by Mahurat trading session. New High was made one day before Mahurat session, Now long should be cautious and profit booking is..
Continue Reading
Bank Nifty Hourly

This sis what we discussed in last analysis Bank Nifty hourly charts are trading in contracting triangle, triangle breakout comes above 15150, if broken and closed over it bank nifty is heading to new high towards 16309 by Mahurat trading session. New High was made one day before Mahurat session, Now long should be cautious and profit booking is..
Sunday, October 26
Nifty ready to march towards all time high,weekly analysis
Last week we gave Nifty Chopad level of 7883 and
Nifty did 2 target of upside rewarding chopad followers by 130 points.
Next week is very crucial for global markets as we have FOMC Meeting
results coming on 30 , Brazil Election results coming tomorrow. We were
able to catch the bottom of Nifty as per Nifty signal bottom formation, FII FnO Data Analysis Next
week is first week in October month having 5 trading days and October
expiry, so trade with extreme caution. Lets analyze how to trade in
expiry week.

Nifty Hourly charts has broken above the trendline resistance now close above
Continue Reading
Nifty Hourly Chart

Nifty Hourly charts has broken above the trendline resistance now close above
Continue Reading
Saturday, October 25
W.D. Gann Trading Techniques - I
Gann Trading strategies
- Importance of number 3
- Tops, bottoms and consolidations
* Divergences will appear at the top but they cannot be used for timing the trade. Time cycles shall indicate when the actual reversal will start.
* In bull market watch for a correction which is greater in both price and time than the previous corrections in the move up. (Opposite in the downmoves).
* Highest probability of support is that the corrections in the uptrend will all be very close to equal.
Weak stocks will generally not rally until either a test of the first bottom..
Thursday, October 23
FII FnO Analysis for Mahurat Trading

- FII's bought 18.6 K contract of Index Future worth 751 cores, 24.6 K Long contract were added by FII's and 5.9 K short contracts were added by FII's. Net Open Interest increased by 30.5 K contract , so FII added long in index futures but are adding shorts.
Nifty performance from Mahurat trading to last trading day of year
September and October month have seen range bound moves, Few days before on my Facebook page we
discussed the possibility of Nifty setting the stage for big move. Here
is some data analysis which will help both traders and investors for
next 2 trading months. Last quarter is considered the most strongest
quarter and market shows trending moves. We have discussed one such
possibility Nifty medium term view using Gann which is going good as of now, lets see How nifty end the year...
Continue Reading
Tuesday, October 21
Bulls celebrate Diwali on Dalal Street, FII F&O Analysis

- FII's bought 10 K contract of Index Future worth 398 cores, 19.1 K Long contract were added by FII's and 9.1 K short contracts were added by FII's. Net Open Interest increased by 28.2 K contract , so FII added long in index futures but started adding shorts also in index futures
- This is what we discussed in last analysis Range of 7930-7940 is supply zone as shown in the below gann box once crossed can see impulsive move in nifty. Nifty again stopped @ yellow line of gann box Once 7930 is crossed next target comes @ 7972/8030.

Nifty Future October Open Interest..
Monday, October 20
FII FnO Data Analysis for 21 Oct

- FII's bought 36.5 K contract of Index Future worth 1455 cores, 40.4 K Long contract were added by FII's and 3.9 K short contracts were added by FII's. Net Open Interest increased by 44.3 K contract , so FII added long in index futures.
Sunday, October 19
How will Nifty react to economic and political news flow ?
Last week we gave Nifty Chopad level of 7883 and
Nifty did 2 target of downside rewarding chopad followers by 151
points. Nifty witnessed a volatile week due to wild swings seen in
global markets. Tomorrow market will open reacting to both political and
economic news. Diesel deregulated, natural gas price hiked and BJP set
to form government in both Maharashtra and Haryana and taking Modiji
dream of "Congress Mukt Bharat" one step closer. Lets see how to trade
market next week. 24 October is again a trading holiday.

Nifty Hourly charts 21/34 EMA have gone flat, trendline support exists @ 7723/30 range, Bulls will get active above ..
Continue Reading
Nifty Hourly Chart
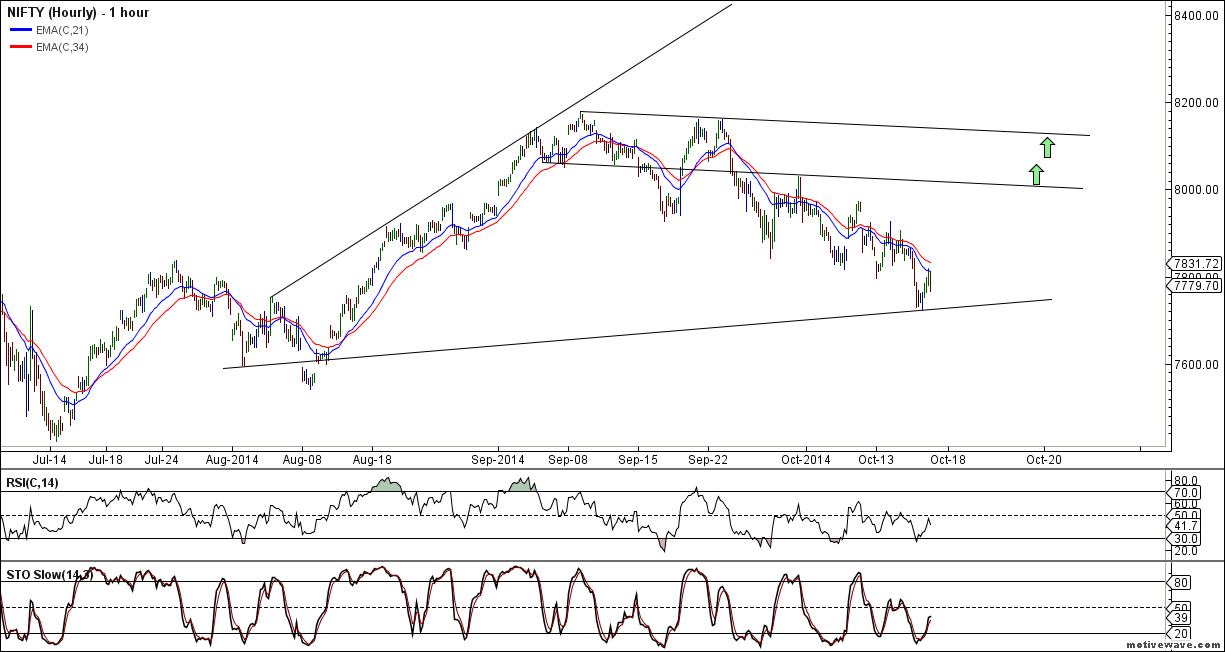
Nifty Hourly charts 21/34 EMA have gone flat, trendline support exists @ 7723/30 range, Bulls will get active above ..
Saturday, October 18
Trading with Clouds
As
if investing was not complicated enough, any mention of ‘technical
analysis’ is likely to cause most individual investors to roll their
eyes and ask “What now?” Fear not. You’re set to learn one of the
easiest and yet most powerful approaches to market analysis that may
help improve your investing and maybe even give you peace of mind.
Technical Analysis (TA), for those unfamiliar with the term, is an approach to market analysis that focuses on price movements. Well-intentioned people can reasonably debate about what the proper value of a share of Google or Coca Cola should be, or what the right value of gold is.
One issue they can’t dispute is what the price of Google, Coke, or gold is now or what it’s been in the past. That’s where technical analysis comes in. Technical Analysis takes the subjectivity (and emotion) out of the picture and zeroes in on the one component of an investment that we can all see: the price.
There are literally hundreds of different approaches to technical analysis, with thousands of books and articles having been written about them. The approach we introduce below is known as Ichimoku, a form of a moving average system. Ichimoku (ee-Chee-Mo-koo) charts offer a powerful tool for investors to identify overall market trends and pinpoint key levels of support and resistance that are unlikely to be revealed by other forms of technical analysis.
Don’t be scared off by the name—that’s where the simplicity comes in. Developed...
Continue Reading
Technical Analysis (TA), for those unfamiliar with the term, is an approach to market analysis that focuses on price movements. Well-intentioned people can reasonably debate about what the proper value of a share of Google or Coca Cola should be, or what the right value of gold is.
One issue they can’t dispute is what the price of Google, Coke, or gold is now or what it’s been in the past. That’s where technical analysis comes in. Technical Analysis takes the subjectivity (and emotion) out of the picture and zeroes in on the one component of an investment that we can all see: the price.
There are literally hundreds of different approaches to technical analysis, with thousands of books and articles having been written about them. The approach we introduce below is known as Ichimoku, a form of a moving average system. Ichimoku (ee-Chee-Mo-koo) charts offer a powerful tool for investors to identify overall market trends and pinpoint key levels of support and resistance that are unlikely to be revealed by other forms of technical analysis.
Don’t be scared off by the name—that’s where the simplicity comes in. Developed...
Wednesday, October 15
Nifty medium term view using Gann
Nifty has been in correction mode ever since it hit the High of 8180
on 08 Sep 2014, It has been in sideways choppy mode from that point of
time.As discussed in our Facebook page we are seeing some big move coming in Nifty.
Using Gann 52 concept , classic technical Analysis I am putting forward the view till end of 2014, use the below view as an input to your trading/investing plan, Do not blindly follow the same.

AS seen in above chart, Nifty is holding on to its trendline support and also 61.8% retracemetn @ 7784, low made was 7796 which signify bulls are still in control over market
Continue Reading
Using Gann 52 concept , classic technical Analysis I am putting forward the view till end of 2014, use the below view as an input to your trading/investing plan, Do not blindly follow the same.
1. Trendline Support

AS seen in above chart, Nifty is holding on to its trendline support and also 61.8% retracemetn @ 7784, low made was 7796 which signify bulls are still in control over market
2. Hammer Candlestick
Continue Reading
Tuesday, October 14
Arvind,Biocon and JSW Steel Harmonic pattern analysis
Arvind

Positional traders should watch for Any close above 288 stock is heading to 300/322.
Intraday traders can use the below levels
Buy above 284 Tgt
FII FnO Data Analysis for 14 Oct


- FII's sold 20.9 K contract of Index Future worth 822 cores, 12.3 K Long contract were squared off and 8.6 K short contracts were added by FII's. Net Open Interest decreased by 3.6 K contract , so FII liquidated long in index futures and added short in index futures.
Sunday, October 12
Bank Nifty Weekly Chart Analysis
Last week we gave Nifty Chopad level of 15306
and Bank Nifty did 3 target on upside and 1 target on downside
rewarding chopad followers by 400 points.IIP numbers were not good and
with global market correcting how to trade bank nifty in coming week.

Bank Nifty hourly charts broke the support zone for a day came back in channel and now near an important support of 15400.Breaking the same 15100 and below its 14750 is on cards. Bullish above 15700 only.


Bank Nifty hourly EW ..
Continue Reading
Bank Nifty Hourly

Bank Nifty hourly charts broke the support zone for a day came back in channel and now near an important support of 15400.Breaking the same 15100 and below its 14750 is on cards. Bullish above 15700 only.
Bank Nifty Hourly Elliot Wave


Bank Nifty hourly EW ..
Nifty Weekly Chart Analysis
Last week we gave Nifty Chopad level of 7966 and
Nifty did 2 target of downside rewarding chopad followers by 151
points. Nifty witnessed a volatile week due to wild swings seen in
global markets.Next week 7784 needs to be closely watched any close
below it can see a sharp decline to 7655. Lets see how to trade market
next week. 15 October is again a trading holiday.

Nifty Hourly charts 21/34 EMA have gone flat, trendline support exists @ 7784/7800 range, Bulls will get active above 7972 for initial target of 8100 and 8175.Bears will get active below 7784 for target of 7725/7655.

Hourly EW is showing correction can be seen till ..
Continue Reading
Nifty Hourly Chart
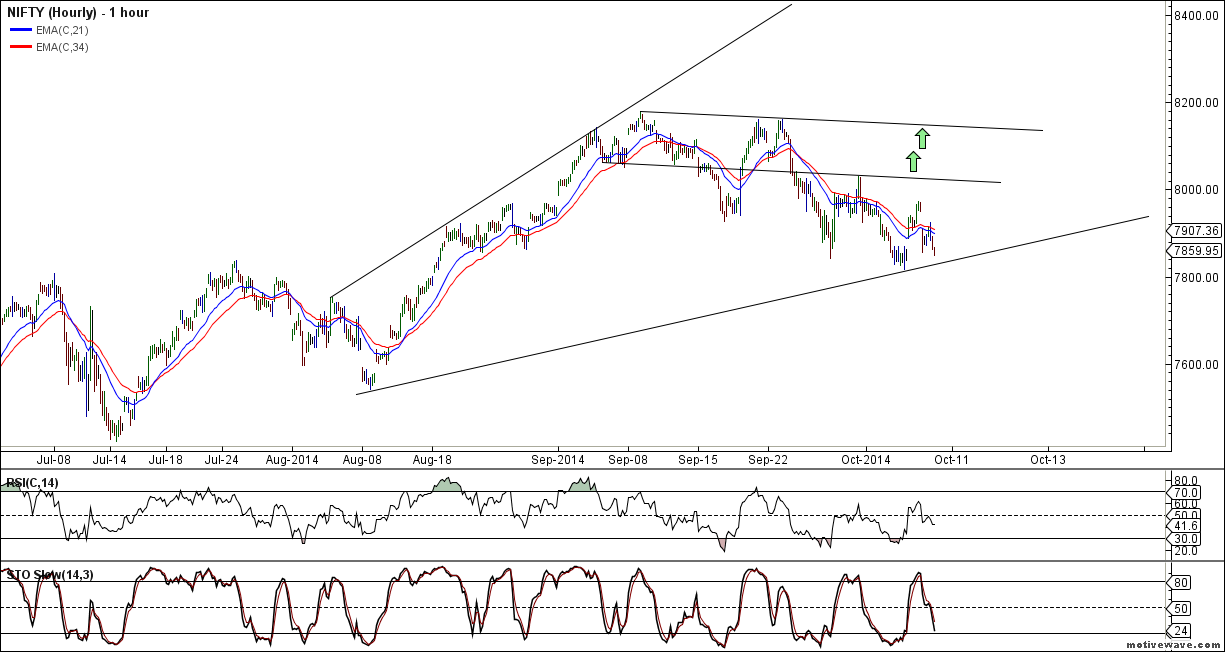
Nifty Hourly charts 21/34 EMA have gone flat, trendline support exists @ 7784/7800 range, Bulls will get active above 7972 for initial target of 8100 and 8175.Bears will get active below 7784 for target of 7725/7655.
Nifty Hourly Elliot Wave Chart
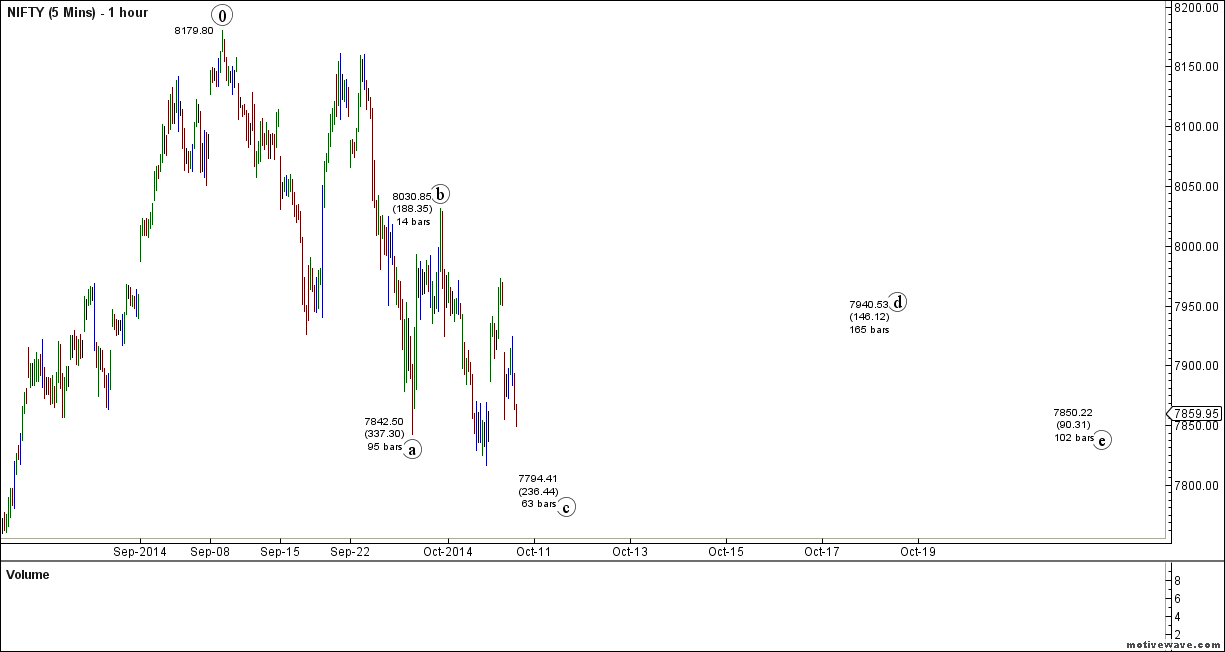
Hourly EW is showing correction can be seen till ..
Saturday, October 11
DriveWealth Invites the World to Invest
DriveWealth’s founder and CEO, Bob Cortright, is a seasoned US
entrepreneur who has built and sold several successful financial
technology companies during his 30 year career.
When he started looking deeply into global investing trends, he was amazed at what he found. “The consumer goods industry had fully developed into a global marketplace, with global companies extending their brand reach worldwide. Look at the top 50 global brands, Apple, McDonalds, Nike, and so on. They are all household names in virtually every market around the world, and the developing markets are particularly voracious consumers of these global brands.”
In fact, over 80% of the growth for these top global brands over the next five years is projected to come from emerging markets. Yet, despite the marketing and advertising efforts by these companies worldwide, there was virtually no access for dedicated customers to invest in these companies. With 85% of the Top 50 global brands being listed in the United States, access to invest in these premier global companies was relegated to the very rich who could afford the $10,000 minimum account balances and $50 round trip trade fees.
Bob’s entrepreneurial light bulb went off, and he began building what is now DriveWealth. DriveWealth is the first truly global online equity investing program, focused on providing low cost access to the most liquid and recognizable US-listed securities to “everyone, everywhere” in the world. After launching the DriveWealth App in late August 2014, the App was downloaded in 80 countries around the world in the first three weeks.
Smart investors know the best long-term investment
Continue Reading
When he started looking deeply into global investing trends, he was amazed at what he found. “The consumer goods industry had fully developed into a global marketplace, with global companies extending their brand reach worldwide. Look at the top 50 global brands, Apple, McDonalds, Nike, and so on. They are all household names in virtually every market around the world, and the developing markets are particularly voracious consumers of these global brands.”
In fact, over 80% of the growth for these top global brands over the next five years is projected to come from emerging markets. Yet, despite the marketing and advertising efforts by these companies worldwide, there was virtually no access for dedicated customers to invest in these companies. With 85% of the Top 50 global brands being listed in the United States, access to invest in these premier global companies was relegated to the very rich who could afford the $10,000 minimum account balances and $50 round trip trade fees.
Bob’s entrepreneurial light bulb went off, and he began building what is now DriveWealth. DriveWealth is the first truly global online equity investing program, focused on providing low cost access to the most liquid and recognizable US-listed securities to “everyone, everywhere” in the world. After launching the DriveWealth App in late August 2014, the App was downloaded in 80 countries around the world in the first three weeks.
Smart investors know the best long-term investment
Thursday, October 9
FII FnO Data Analysis for 10 Oct

- FII's bought 14.3 K contract of Index Future worth 566 cores, 12.4 K Long contract were added and 1.8 K short contracts were squared off by FII's. Net Open Interest decreased by 10.6 K contract , so FII added long in index futures and covered partial short in index futures.
Wednesday, October 8
Nifty near gann box support, Be ready for big move

- FII's bought 4.9 K contract of Index Future worth 196 cores, 9.2 K Long contract were squared off and 4.3 K short contracts were squared off by FII's. Net Open Interest decreased by 13.6 K contract , so FII squared off both long and short in index futures.
Tuesday, October 7
Monday, October 6
FII FnO Data Analysis for 07 Oct

- FII's bought 1.8 K contract of Index Future worth 72 cores, 584 Long contract were added and 1.2 K short contracts were added by FII's. Net Open Interest decreased by 666 contract , so FII added long and short in index futures.
Continue Reading
What's common between best sportsman and Successful Traders
If you ever met a successful trader one thing you would have noticed
most of them in some part of there life were related to sports. What’s
the connection between being an sportsman and stock market trader? I
believe it has everything to do with the qualities and the mindset that
these individuals have. I have discussed few traits that I think
successful traders share with elite sportsman.

Do you remember Sachin Tendulkar tennis elbow injury 2004 ? Sachin Tendulkar feared his career was over when he got the surgeny done. It was son worse he couldn't even pick up his son Arjun's plastic bat. But he remained competitive and motivated and we know best of his cricket came after recovery from this injury.
Continue Reading
Both of them are competitive.

Do you remember Sachin Tendulkar tennis elbow injury 2004 ? Sachin Tendulkar feared his career was over when he got the surgeny done. It was son worse he couldn't even pick up his son Arjun's plastic bat. But he remained competitive and motivated and we know best of his cricket came after recovery from this injury.
Nifty Weekly Outlook for 07 Oct -10 Oct
Last week we gave Nifty Chopad level of 15696
and Bank Nifty did 3 target on downside rewarding chopad followers by
300 points. We have IIP Data coming with coal scam putting pressure on
banks Lets analyze how to trade bank nifty in coming week.

Bank Nifty hourly charts broke the support zone of 15450 saw a decline till 15200 odd levels and closed below this support zone,moving above 15600 bank nifty can move towards another life highs.
Continue Reading
Bank Nifty Hourly

Bank Nifty hourly charts broke the support zone of 15450 saw a decline till 15200 odd levels and closed below this support zone,moving above 15600 bank nifty can move towards another life highs.
Bank Nifty Hourly Elliot Wave
Continue Reading
Sunday, October 5
Nifty Weekly Outlook for 07 Oct -10 Oct
Last week we gave Nifty Chopad level of 7990 and
Nifty did a low of 7923 on downside almost achieving the 1 target is
Holiday shortened week.Next week traders need to Watch For Fed Minutes
which will come Wednesday night ,Brazil Election and Bank of England
decision will impact the market. Lets see how to trade market next week.
Nifty trading will start on Tuesday as Monday is again a trading
holiday.

Nifty Hourly charts 21/34 EMA have gone flat, trendline support exists..
Continue Reading
Nifty Hourly Chart
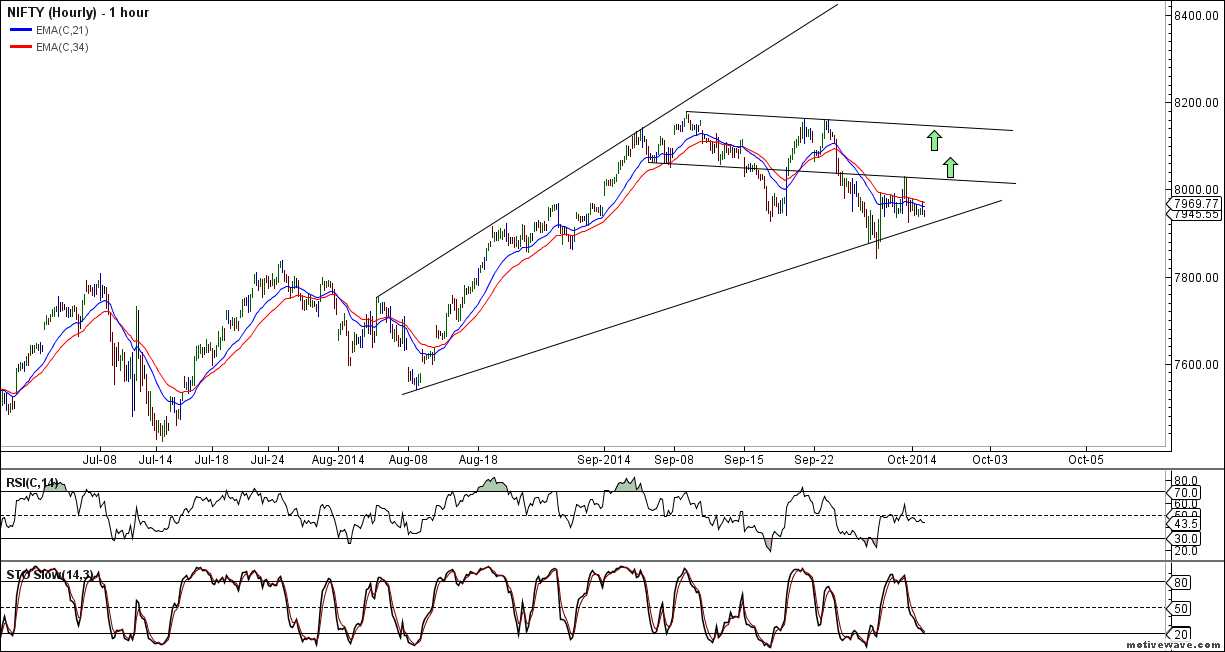
Nifty Hourly charts 21/34 EMA have gone flat, trendline support exists..
Continue Reading
W. D. Gann the legendary Financial Prophet
To most of the technical analysts and financial
traders, the name, William Delbert Gann, is well-known. Gann was one of
the greatest traders in the early twenty centuries, who has extremely
arcane trading analysis techniques and methods that based on ancient
mathematics and geometry. Yet, as it was never unveiled explicitly, the
theory of Gann is admired by most, but grasped by few.
To understand Gann's theories, it is essential to know his life and living.
W.
D. Gann was born in an Irish family in Lufkin, Texas in the United
States on 6 June 1878. His parents are devoted Christians with a strong
Methodist background. W. D. Gann was himself a devoted Christian. He
claimed that his market cycle theories were discovered from the Holy
Bible.
The home country of Gann was a cotton land, the influence to the childhood of the great trader was understandable. With
Gann was 24 in 1902, he made his first trade in cotton futures contract
and enjoyed the profit from trading. The 53 years of trading hereafter,
it was said that he had gained US$50 million from the market. The
wealth of that scale compared with the purchasing power at his time was,
in deed, very substantial.
In 1906,
Gann moved to Ohakama with ambition to start up his career as broker and
trader. His life and trading are with up and down. His advice after
decades of trading were that if an investor enters the investment market
without a grasp of knowledge, his chance to failure would be 90%. The reasons behind their failures are human emotions: hope, greed and fear are ...Saturday, October 4
US Stock Market 7 Year Cycle of Boom and Bust
Large numbers of people believe that an economic crash is coming next
year based stock crash images-1 on a 7-year cycle of economic crashes
that goes all the way back to the Great Depression. Such a premise is
very controversial – some of you will love it, and some of you will
think that it is utter rubbish – so I just present the bare bone facts
below for you decide for yourself if it is something to seriously
consider protecting yourself from in 2015.
As can be seen below economic crashes of one kind or another occur approximately every 7 years going all the way back to the Great Depression.
Continue Reading
As can be seen below economic crashes of one kind or another occur approximately every 7 years going all the way back to the Great Depression.
- 2008 :Lehman Brothers collapsed, the stock market crashed and we were plunged into the worst recession that we have experienced as a nation since the Great Depression.
- 2001: The dotcom bubble burst, there was a year of recession for the U.S. economy, big trouble for stocks and that little event known as “9/11″ happened that year.
- 1994: Yields on 30-year Treasuries jumped some 200 basis points in the first nine months of the year, hammering investors and financial firms, not to mention thrusting Mexico into crisis and bankrupting Orange County.
Friday, October 3
How to trade using Darvas Boxes
Nicolas Darvas developed his famous method for identifying stock trends using “Darvas Boxes” in the late 1950s.
His goal was to create a trading system that allowed him to ride a powerful stock’s rising trend for as long as it remained in that rising trend.
This is obviously a simple and logical concept, but extremely difficult to implement. The difficulty lies in deciphering what is a “normal” correction within a rising trend and what is an “abnormal” correction, which breaks the rising trend.
There are numerous methods used for determining stock and commodity trends. There’s the original Dow Theory, Jesse Livermore’s “Pivotal Points,” Richard Donchian’s moving averages, the famous Turtle breakout system, classic chart patterns, and on and on this list could stretch. All of these methods work to a certain extent and a successful trend trader usually implements portions of each.
Like the trend trading strategies listed above, the Darvas Box System stands the test of time.
Why is that so? Why do Darvas Boxes continue to properly identify trends more than 50 years after Nicolas Darvas first discovered their validity?
The quick answer is to quote Jesse Livermore, who famously stated,
Continue Reading
His goal was to create a trading system that allowed him to ride a powerful stock’s rising trend for as long as it remained in that rising trend.
This is obviously a simple and logical concept, but extremely difficult to implement. The difficulty lies in deciphering what is a “normal” correction within a rising trend and what is an “abnormal” correction, which breaks the rising trend.
There are numerous methods used for determining stock and commodity trends. There’s the original Dow Theory, Jesse Livermore’s “Pivotal Points,” Richard Donchian’s moving averages, the famous Turtle breakout system, classic chart patterns, and on and on this list could stretch. All of these methods work to a certain extent and a successful trend trader usually implements portions of each.
Like the trend trading strategies listed above, the Darvas Box System stands the test of time.
Why is that so? Why do Darvas Boxes continue to properly identify trends more than 50 years after Nicolas Darvas first discovered their validity?
The quick answer is to quote Jesse Livermore, who famously stated,
How to Control Your Emotions When You Trade
When we speak of “The Trader’s Mindset” what are we really talking
about? Many of my studentsoften ask me this question and we talk about
it a lot with traders I mentor.
When we trade the markets we approach the markets each and every day with a psychological mindset or set of beliefs and emotions. New traders often enter trading with beliefs about trading and the markets that simply do not apply to the realities of trading. This is why new traders get into trades and can’t get out or don’t know when to take profits or get out at the bottom and get in at the top of markets. In other words they make bad trades because they are trading from inaccurate beliefs and become subject to their emotions of fear and greed.
With proper education, experience and direction these traders can turn their trading around. Usually new traders realize after awhile of experiencing large losses or working very hard and still losing that they need to change. What they thought would work does not and they recognize that their emotions are working against them and not for them in trading.
Once they get to this point, traders either quit trading or ...
Continue Reading
When we trade the markets we approach the markets each and every day with a psychological mindset or set of beliefs and emotions. New traders often enter trading with beliefs about trading and the markets that simply do not apply to the realities of trading. This is why new traders get into trades and can’t get out or don’t know when to take profits or get out at the bottom and get in at the top of markets. In other words they make bad trades because they are trading from inaccurate beliefs and become subject to their emotions of fear and greed.
With proper education, experience and direction these traders can turn their trading around. Usually new traders realize after awhile of experiencing large losses or working very hard and still losing that they need to change. What they thought would work does not and they recognize that their emotions are working against them and not for them in trading.
Once they get to this point, traders either quit trading or ...
Thursday, October 2
How to Trade using Harmonic Price Patterns
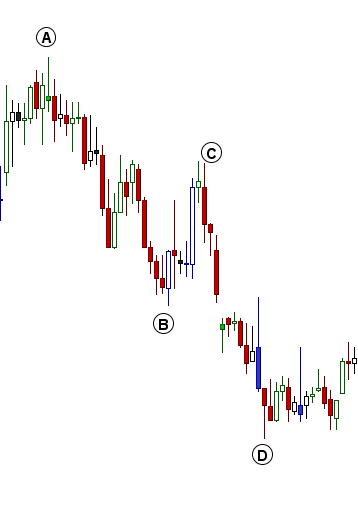
How to trade ABCD Harmonic Pattern
There are three basic steps in spotting Harmonic Price Patterns:
- Step 1: Locate a potential Harmonic Price Pattern
- Step 2: Measure the potential Harmonic Price Pattern
- Step 3: Buy or sell on the completion of the Harmonic Price Pattern
Let’s see this process in action!
Step 1: Locate a potential Harmonic Price Pattern
I have shown Hourly chart of Ambuja Cement and market the potential harmonic pattern in forming
Wednesday, October 1
DRL,BoB and Bata India technical analysis
DRL

Holding 3194 stock is heading back to 3316/3356 odd levels in short term.
