Saturday, February 28

Highlights of Union Budget 2015

Here are the highlights of Jaitley's Budget for the fiscal year that begins on April 1.
TAXATION
* To abolish wealth tax
* Replaces wealth tax with additional 2% surcharge on super rich
* Proposes to cut to 25 percent corporate tax over next four years
* Corporate tax of 30 percent is uncompetitive
* Net gain from tax proposals seen at Rs 150.68 billion
* Jaitley proposes modification of permanent establishment norms so that the mere presence of a fund manager in India would not constitute a permanent establishment of the offshore fund, resulting in adverse tax consequences.
* Proposes to rationalise capital gains tax regime for real estate investment trusts
* Expects to implement goods and services tax by April 2016
* To reduce custom duty on 22 items
* Proposes to increase service tax rate and education cess to 14 percent from 12.36 percent
* Plans to introduce direct tax regime that is internationally competitive on rates without exemptions
* Exemptions for individual tax payers to continue
* To enact tough penalties for tax evasion in new bill
* Tax dept to clarify indire
Continue Reading

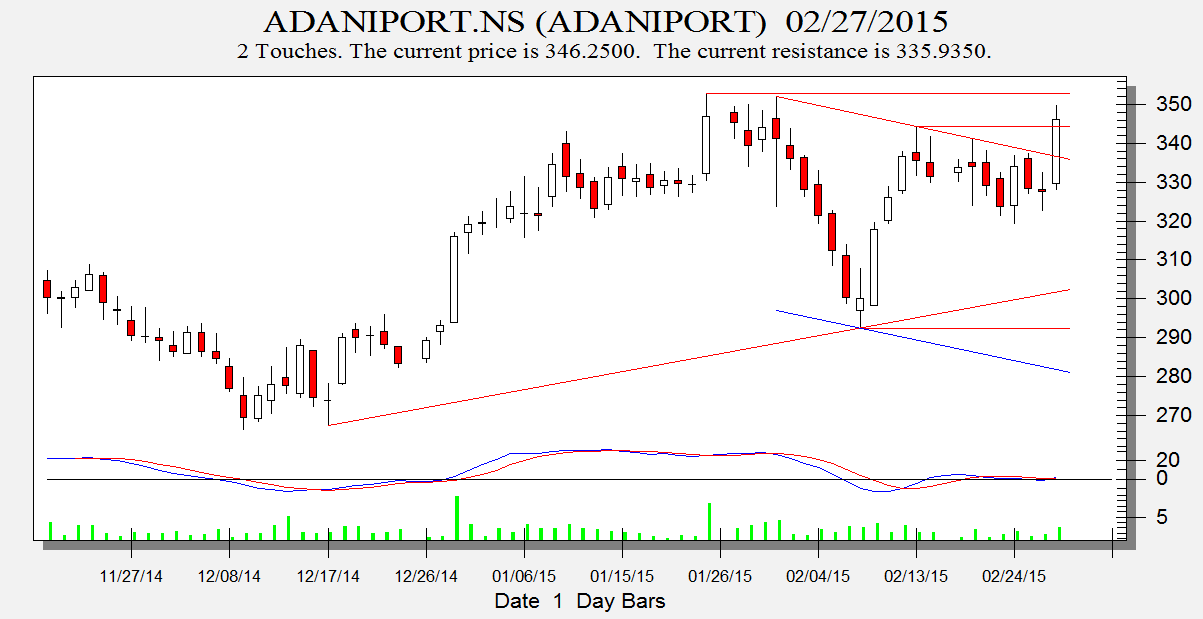
Adani Port,IGL and Petronet positional analysis

Adani Port

Adani Port
Any close above 356 stock is heading to 364/369 and 377. Any close below 343 short term target 322.
Intraday Traders can use the below mentioned levels

Buy above 350 Tgt..


Continue Reading

Friday, February 27

FII FnO Data Analysis for Union Budget 2015

FII
Tomorrow we have the budget day, Expectation are High Stock Market soared on expectation of reformist budget, Budget day is known for wild swing. Do remember even if expectation are met market can react negatively like happened in May 2014 Election result day Market soared but gave huge..

Continue Reading

PFC,ITC and IRB short term technical Analysis

IRB

IRB

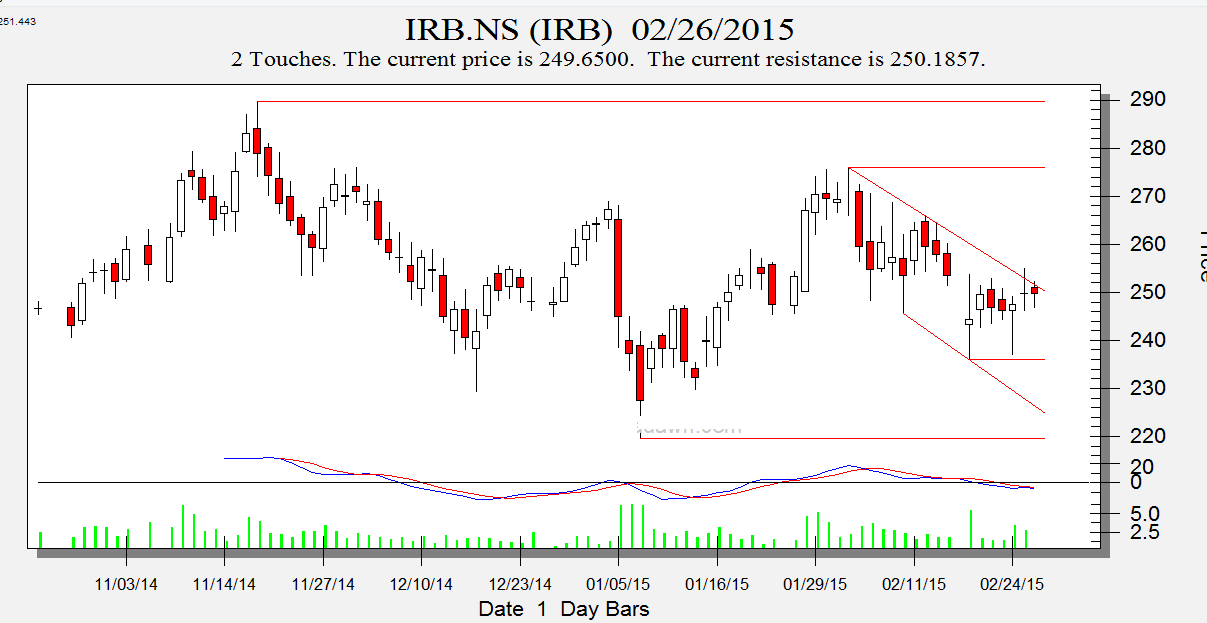
Any close above 254 stock is heading towards 267/288/300 in short term.
Intraday Traders can use the below mentioned levels

Buy above 250 Tgt..


Continue Reading

Thursday, February 26

Nifty reacts negatively on Railway Budget,FII Data Analysis

FII
  • FII's sold 30.2 K contract of Index Future worth 870 cores, 150 K Long contract were squared off by FII's and 138 K  short contracts  were squared off by FII's. Net Open Interest decreased  by 289 K contract,79.3 % Rollover is done in Nifty Future at an average rate of 8837. I have discussed which traders can use as an Input to their trading plan for Budget Day Stock Market Response to past Union Budget and  Option Trading Strategy for Union Budget 2015 .
We saw the best Railway Budget presented today in past 10 years which was practical and pragmatic. Nifty reacted on railway budget day with negative as it happened on last railway budget and forewarned in yesterdays analysis  Last time Nifty was down
Continue Reading

Highlights of the Railway Budget 2014-15

Thrust
1. Safety 2. Project Delivery 3. Passenger Amenities/Services with focus on food services & on cleanliness, sanitation, toilets 4.
Financial Discipline 5. Resource Mobilization 6. IT Initiatives 7. Transparency & System Improvements.

Course Correction and Initiatives

Works to be re-prioritized with more focus on doubling and tripling to decongest the over-utilized network.
Recent fare and tariff hike to mop additional revenue of about ` 8,000 cr. Alternate resource mobilization need to be explored as enlisted.
o Leveraging Railway PSU Resources by bringing in their investible surplus funds in infrastructure projects of Railways.
o Domestic investments and FDI in rail infrastructure. o Pursuing Public Private Partnership.
Near Plan-holiday approach.
Prioritizing and setting timelines for completion of the ongoing projects.
Decision Support System for project implementation.
Strategic partnerships and transparency in procurements.
Aggressive indigenization of imported products.
Developing locomotives, coaches and wagon leasing Market.

Continue Reading

Kotak,Ranbaxy and LT technical analysis

Kotak Bank

Kotak Bank

Intraday Traders can use the below mentioned levels

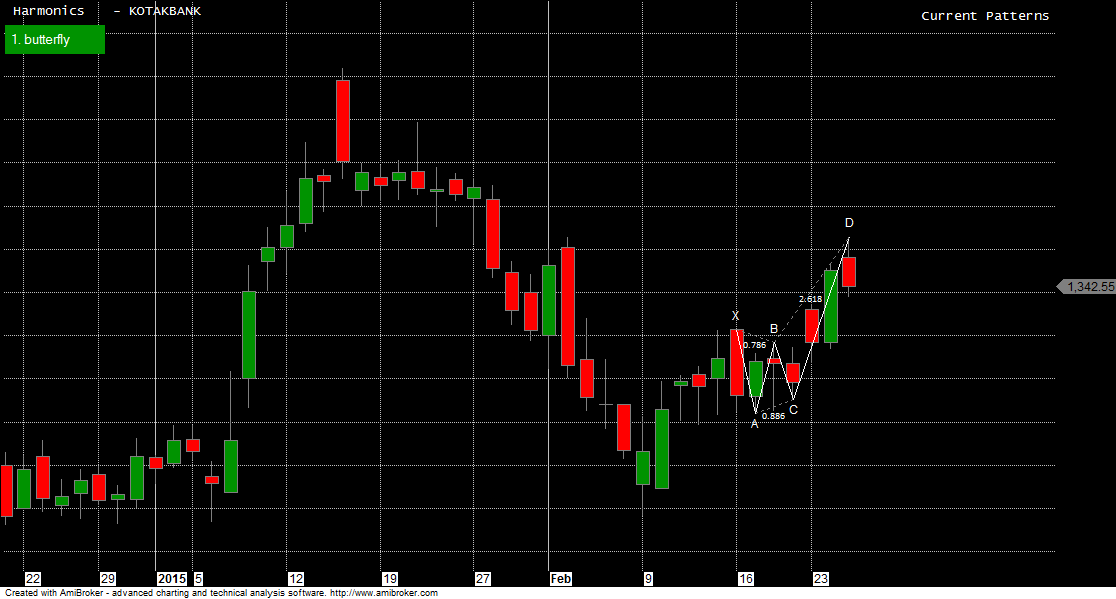
Buy above 1349 Tgt..


Continue Reading

Wednesday, February 25

Nifty Technical Analysis before Railway Budget and Feb Expiry

FII
  • FII's sold 34.2 K contract of Index Future worth 931 cores, 52.5 K Long contract were added by FII's and 86.5 K  short contracts  were added  by FII's. Net Open Interest increased  by 139 K contract ,so FII's added  long  and added shorts in Index Futures with high volumes,signifying rollovers are happening. As of now 67.1% Rollover is done in Nifty Future.
Nifty had another volatile session of trade today opening with gap up and closing the gap during the day, forming low of 8751,unable to close above the green line of gann box  and again closed below 21/34 EMA. Support lies in range of 8700-8680 and resistance in range of 8820-8840 range. Railway Budget..

Continue Reading

The Perfect Trader

he Perfect Trader
  • The Perfect Trader is patient with entries and exits.
  • The Perfect Trader is focused on what works not personal opinions.
  • They do not worry about missed trade.
  • The Perfect Trader does not boast while winning and does not become depressed while losing.
  • They are never too proud to admit when they are wrong and exit their trade.
  • They do not give unsolicited advice to other traders because they know everyone trades their own system and their own plan.

Continue Reading

Tuesday, February 24

Asian Paints,Sun Pharma and IDFC trading strategy

IDFC

IDFC

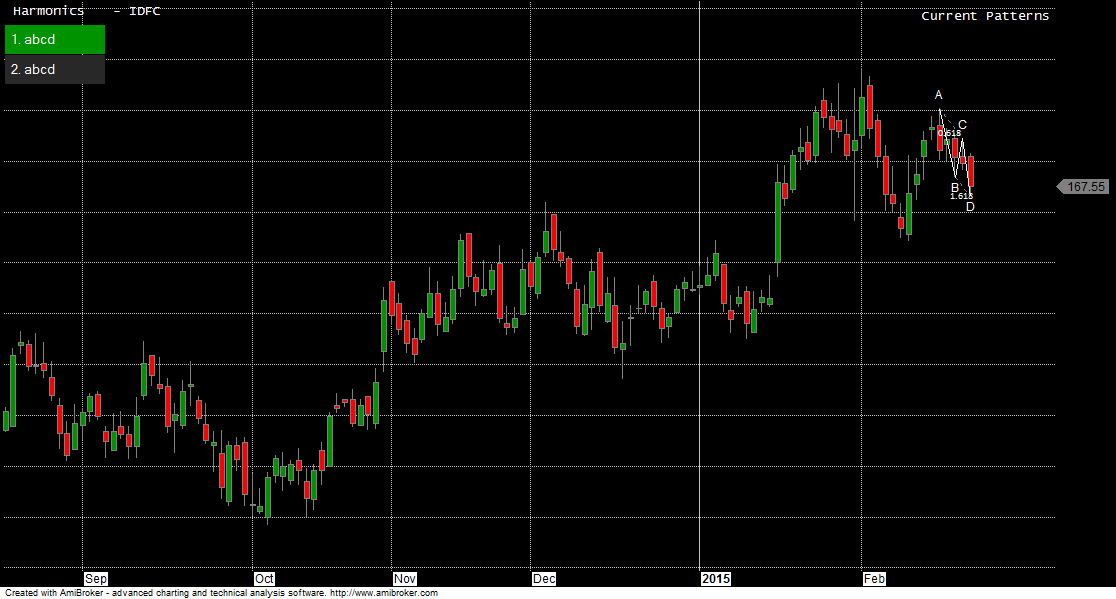
Holding 165 stock can bounceback to 178
Intraday Traders can use the below mentioned levels

Buy above 168.3 Tgt..


Continue Reading

Monday, February 23

FII FnO Data Analysis for 24 Feb

FII
  • FII's bought 5.7 K contract of Index Future worth 121 cores, 6.8 K Long contract were added by FII's and 1.1 K  short contracts  were added  by FII's. Net Open Interest increased  by 7.2 K contract ,so FII's added  long  and added shorts in Index Futures with high volumes,signifying rollovers are happening. As of now 37.9% Rollover is done in Nifty Future.
Nifty was consolidating for better part of day than big downmove started from  2 PM which saw Nifty declining and closing below its 20 SMA. Nifty also made low at 8737...

Continue Reading

Auro,JSW Energy and RCOM Darvas Box Analysis

Auro Pharma

Auro Pharma

Any close above 1076 stock is heading 1131/1200.
Intraday Traders can use the below mentioned levels

Buy above 1062 Tgt..


Continue Reading

Sunday, February 22

Union Budget 2015: Bank Nifty Weekly Analysis

Last week we gave the Chopad level of 19466 Bank Nifty achieved 2 target on downside.Coming week has 6 trading session as market will remain open on Saturday as Union Budget will be presented. I have discussed which traders can use as an Input to their trading plan for coming week Stock Market Response to past Union Budget and  Option Trading Strategy for Union Budget 2015 .Lets analyze how to trade next week.

 Bank Nifty Hourly

Bank Nifty Hourly

Bank Nifty is forming triangle on hourly chart suggesting breakout/breakdown is on cards. Break of..

Continue Reading

Union Budget 2015:Nifty Weekly Analysis

Last week we gave Chopad Levels  of 8840  and discussed nifty is ready for pre budget rally but last week Nifty on Weekly basis has the smallest range in past 15 years. Weekly Range was just 120 points and the expected Pre Budget rally was not seen. We saw a roller coaster ride in last week with Nifty and Bank Nifty swinging wildly and both indices in small range. Coming week has 6 trading session as market will remain open on Saturday as Union Budget will be presented. I have discussed which traders can use as an Input to their trading plan for coming week Stock Market Response to past Union Budget and  Option Trading Strategy for Union Budget 2015 .Lets analyze how to trade next week.

 Nifty Hourly Chart

nifty hourly
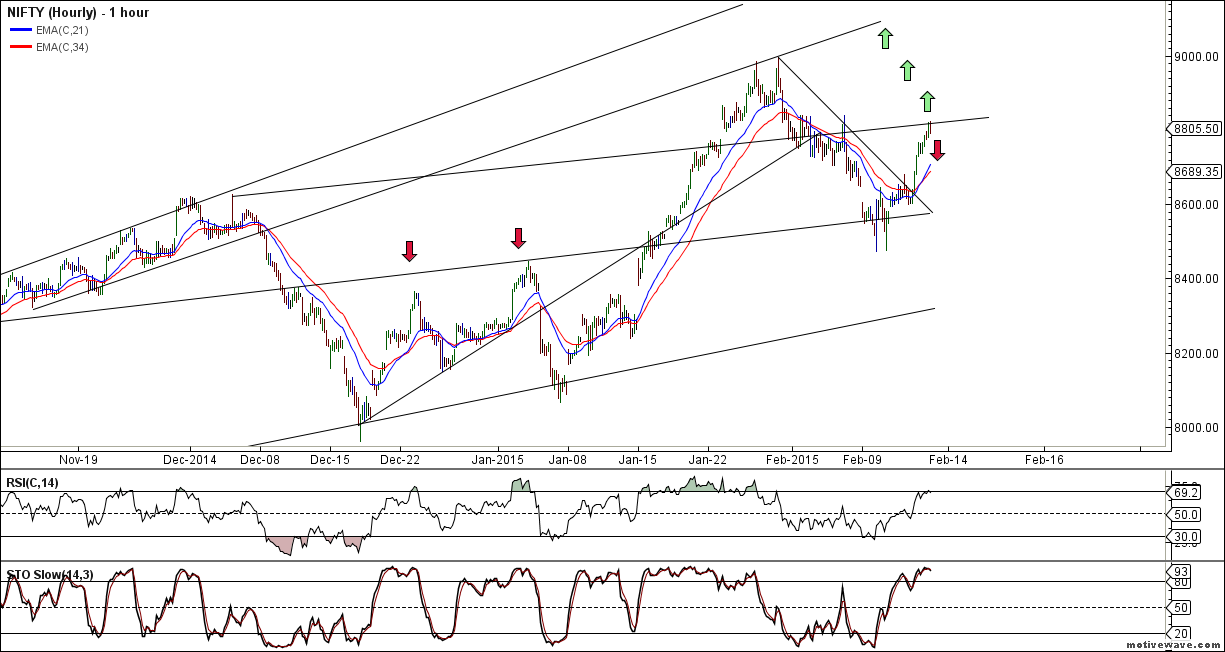
Nifty Hourly charts has taken support at its  21 HEMA on downside and is near strong trendline resistance on upside from where Nifty has turned back 2 times before, Closing

Continue Reading

Saturday, February 21

Option Trading Strategy for Union Budget 2015

Indian Union Budget will be presented on 28 Feb 2015 , and as discussed in previous post Nifty remains in a wide range so there is  an opportunity to trade in Nifty Options  And the opportunity could turn out to be quite promising.
Which will be market direction post budget we do not know so its  best we take a position that is completely independent of the direction of the market and possibly make money out of it.
Though we dont have an idea of the direction, historically, the maximum change in Nifty from the budget date to the next expiry date is quite decent in either direction. So, we can fairly assume that the move post budget is going to be big as it always is. So lets discuss the Option Strategy

Long..


Continue Reading

Stock Market Response to past Union Budget

As SEBI has decided to keep market open on Budget day which will be presented on 28 Feb by Honorable Finance Minister Shri Arun Jatielyji. As this the first Budget under the leadership of Shri Narendra Modiji so will be keenly watched by whole world.
Will it be one of Dream Budget ?
Union Budget is just 5 days away, Below i have discussed Nifty range from 1999-2014. Maximum Range on Budget day is 346 so big volatile move on cards, so trade cautiously.

Below we have discussed the range..


Continue Reading

Greece Deal Reached Gets 4 month extension

Eurogroup statement on Greece

The Eurogroup reiterates its appreciation for the remarkable adjustment efforts undertaken by Greece and the Greek people over the last years. During the last few weeks, we have, together with the institutions, engaged in an intensive and constructive dialogue with the new Greek authorities and reached common ground today.

The Eurogroup notes, in the framework of the existing arrangement, the request from the Greek authorities for an extension of the Master Financial Assistance Facility Agreement (MFFA), which is underpinned by a set of commitments. The purpose of the extension is the successful completion of the review on the basis of the conditions in the current arrangement, making best use of the given flexibility which will be considered jointly with the Greek authorities and the institutions. This extension would also bridge the time for discussions on a possible follow-up arrangement between the Eurogroup, the institutions and Greece.

The Greek authorities will present a first list of reform measures, based on the current arrangement, by the end of Monday February 23. The institutions will provide a first view whether this is sufficiently comprehensive to be a valid starting point for a successful conclusion of the review. This list will be further specified and then agreed with the institutions by the end of April.


Continue Reading

Friday, February 20

Bulls and Bears fighting in 100 points range, who will win ?

FII
  • FII's sold 23.7 K contract of Index Future worth 641 cores, 16.5 K Long contract were squared off FII's and 7.2 K  short contracts  were added  by FII's. Net Open Interest decreased  by 9.2 K contract ,so FII's squared off long  and added shorts in Index Futures in volatile session of trade.
Nifty closed in red after  7 day of rise , it was a roller coaster ride for market today but was able to close above the hourly trendline resistance.  Gann Box was unable to cross the yellow line and corrected back to green line. Nifty has been rangebound in the range of 8800-8900 in past 2 session expect a good


Continue Reading

Federal Bank,HZL and Rel Cap Harmonic trading pattern analysis

Federal Bank

Fedral Bank
Any close above 137 stock is heading to 141/144.
Intraday Traders can use the below mentioned levels

Buy above 137 Tgt..


Continue Reading

Thursday, February 19

Nifty closed above Hourly trendline resistance, Whats next

FII
  • FII's sold 24.6 K contract of Index Future worth 503 cores, 24.7 K Long contract were squared off FII's and 170  short contracts  were squared off by FII's. Net Open Interest decreased  by 24.1 K contract ,so FII's squared off long  and shorts in Index Futures in volatile session of trade.
Nifty rose for 7 day in row , it was a roller coaster ride for market today but was able to close above the hourly trendline resistance as shown in hourly charts. Trend is up with higher highs formation intact. Gann Box is also approaching the yellow line and close above it will make sure we reach new all time high. As per Quant analysis We had..

Continue Reading

Which Trading Style suits you:Day or Swing Trading

There is a wide variety of styles when it comes to trading; however the two most popular styles for future traders are day trading and swing trading.
Lets understand the differences between the styles so you can find the best one to fits your trading style, risk tolerance and trading goals. Every trader is completely different and for that reason one style is not better than the other.
Sleep better at night with Day Trading
Being a day trader probably takes a little bit more discipline than swing trader because traders have to follow one very strict rule: “no overnight positions.” Day traders should only trade during the most active session for their particular market, and be flat (have no positions) by the close of the markets . The biggest benefit to this style of trading is that traders don’t have to worry about market fluctuations in the due to overnight events.
Traders who have low risk tolerance might prefer a day trading strategy to avoid overnight risk.
However there are some drawbacks to this strategy and the biggest one being that the trader needs a much higher degree o
Continue Reading

Tuesday, February 17

Why Traders should NOT set money or percentage goals

First of all: Happy Maha Shivratri !!
On this auspicious occasion We as traders should make resolutions that should enable us to finally escape the unprofitable trading behavior . The truth is, after one week of great trading, most traders will fall back into old patterns and desperately chase the millions they think they can make by using bigger positions, taking trades based on guessing and looking for new and better trading systems. By considering and answering the following points, and not forgetting them throughout the year, you will come your goal of becoming a consistently profitable trader a lot closer.

Honest Self-Check

The first step towards becoming the consistently profitable trader, who lives from his trading profits, is being clear about where you are now.
Ask yourself the following questions to get a clear picture of your current standpoint as a trader:
  1. How long have I been trading? If you have been trading for a few years and still cannot see the light at the end of the tunnel, it is time to change EVERYTHING you do about trading.
  2. Am I close to making it as a trader? ...
Continue Reading

Greece Update - Again no decision, but options are clear

From Deutsche Bank
Today's second Eurogroup meeting on Greece was cut short, again concluding in deadlock. The atmosphere remains tense, but through all the multiple and conflicting headlines, the subsequent Eurogroup press conference provides us with a clear framework on how the Greek crisis will progress over the next few days and weeks.
First, Eurogroup chair Dijsselbloem has formally confirmed that Europe's preferred path forward is a Greek request to legally extend the current program that expires on February 28th. Such a request needs to materialize by the end of the week, to give time to six national parliaments (inclusive of the Netherlands, Germany and Finland) to pass this extension through into legislation. Failing this deadline Dijsselbloem confirmed that the only option that would then be left to Greece would be a request for a fresh 3rd ESM program. All in all, the starting point therefore remains the same as the one we had outlined a few weeks ago: semantics aside, Greece can choose to either extend the program or apply for a new one.
Second, it is now also clear that either program extension, or a potential new program will require specific conditions. Eurogroup head Dijsselbloem specified three conditions, which are also apparent in the leaked Eurogroup draft statement that was rejected by the Greek side: a commitment to fulfill financial obligations (ie. repay debt), a commitment to not take unilateral actions (ie. to not reverse prior program policy) while negotiations are..
Continue Reading

Monday, February 16

FII FnO Data Analysis for 18 Feb

FII
  • FII's bought 21.7 K contract of Index Future worth 512 cores, 2.2 K Long contract were added  by FII's and 19.5 K  short contracts  were squared off by FII's. Net Open Interest decreased  by 17.2 K contract ,so FII's added long  in Index Futures and squared off shorts in index futures.
Nifty rise was again halted  near a big trendline resistance of 8830-8840 range, Nifty has 3 failed attempt in crossing this range, and today crossed above it but was again unable to cross.   Gann Box is also approaching the green line but still unable to close above it keeping both bulls and bears in limbo.

Continue Reading

Darvas Box Stock Trading:LIC,HCL Tech and HDFC

LIC Housing

LIC
Holding 466 stock is heading to 492/521
Intraday traders use below mentioned levels

Buy above 471.5 Tgt..


Continue Reading

Sunday, February 15

Bank Nifty ready to march to 20K,Weekly Analysis

Last week we gave the Chopad level of 18686 Bank Nifty achieved 2 target on downside and 3 target on upside rewarding chopad followers by 900 points  . Lets analyze how to trade Bank Nifty in coming week as RBI policy is due.

 Bank Nifty Hourly

Bank Nifty Hourly
As discussed last weeek Bank NIfty hourly charts are approaching the demand zone as seen in hourly chart so range of 18600-18400 needs to be closely watched holding the same can see sharp and swift move on upside. Unable to do so can fall till 18000.

Bank Nifty reacted sharply..
Continue Reading

Nifty ready for pre budget rally,Weekly Analysis

Last week we gave Chopad Levels  of 8806  and discussed nifty is ready to make short term bottom on AAP Win How will market react to AAP win  Nifty did 3 target  on upside. We saw a roller coaster ride in last week with Nifty and Bank Nifty swinging wildly and both indices closing at weekly high and setting ground for pre budget rally.Lets analyze how to trade next week, Tuesday is Trading holiday on account of Maha Shivratri.

 Nifty Hourly Chart

nifty hourly
Nifty Hourly charts has broken its both 21/34 HEMA on upside and is near strong trendline resistance from where Nifty has turned back 3 times before, Closing

Continue Reading

Saturday, February 14

How Yen carry trade can drive stock market higher

The Origin of Yen Carry Trade starts from way back in 1990
In 1990 The Bank of Japan had managed to burst bubbles in the Japanese stock and real estate market, by raising interest rates. This brought the economic growth to a standstill.
After bursting the bubbles by raising interest rates, the Bank of Japan had to start cutting interest rates and soon the rates were close to 0 percent. This meant that anyone looking to save money by investing in fixed-income investments (i.e., bonds or bank deposits) in Japan would have made next to nothing.
This led to the Japanese looking for returns outside Japan. Some housewife traders started staying up at night to trade in the European and the North American financial markets.
They borrowed money in yen at very low interest rates, converted it into foreign currencies and invested in bonds and other fixed-income instruments giving higher rates of returns than what was available in Japan.
Over a period of time, these house

Continue Reading 

Technical Indicators: Force Index Introduction

Introduction

The Force Index is developed by Trading for a Living fame author Alexander Elder , is an oscillator that measures the force of bulls behind particular market rallies and of bears behind every market correction.According to Elder, there are three essential elements to a Financial Instrument price movement: direction of  market move ie Up or down, extent of the move and volume.Force index is one of the best indicators for combining both price and volume.
The three key components of the force index are:
  1. Direction of Price Change
  2. Extent of Price Change
  3. Trading Volumes
The Force Index combines all three as an oscillator that fluctuates in positive and negative territory as the balance of power shifts. The Force Index can be used to reinforce the overall trend, identify corrections and  reversals in Financial Markets.

Calculation


Continue Reading

Will 8840 play spoilsport for Bulls ?

FII
  • FII's bought 55.6 K contract of Index Future worth 1137 cores, 38.7 K Long contract were added  by FII's and 16.9 K  short contracts  were squared off by FII's. Net Open Interest increased  by 21.8 K contract ,so FII's added aggressive long  in Index Futures and squared off shorts in index futures.
Nifty did a follow up on breakout on Hourly chart, now is again near a big trendline resistance of 8830-8840 range, Nifty has 3 failed attempt in crossing this range, once crossed we can see another trending move on upside. Gann Box is also approaching the green line as shown in below chart, once crossed we..

Continue Reading

Friday, February 13

80% Of Trading Is

80% of trading is behavioral, maybe only 20% is based on the other things that a trader does. Like much of personal finance it is not the math but the behavior that makes all the difference. Most people’s problem with being broke does not lie in their budget it is due to their behavior of spending too much money because they lack self control. The inability to say no to yourself in the present is what leads to most of the problems that we encounter at a future time. You can’t out earn stupid and you can’t budget away a lack of self control or work ethic. The same applies to trading.
Wanting to be a trader is only the beginning, once you make that decision you have to do the work to learn how to create a winning trading system. Having a robust trading methodology is still by far not enough it has to be expressed in a trading plan that also controls risk and fits your personalty. Even then, a trading plan is not enough you still have to follow it with discipline consistently for it to work out for you in the long term and make you profitable. But wait, there’s more…. you have to have the passion and perseverance in the market to shake off a losing streak and draw down and keep going. A great trading
Continue Reading

ACC,SBI and Bata India trading plan

SBI

SBIN
Any close above 288 stock is heading back to 300/322.
Intraday traders use below mentioned levels

Buy above 286 Tgt


Continue Reading

Thursday, February 12

Nifty does breakout on Hourly chart, Will it Sustain ?

FII
  • FII's sold 28.8 K contract of Index Future worth 619 cores, 2.4 K Long contract were added  by FII's and 30.8 K  short contracts  were added by FII's. Net Open Interest increased  by 7.3 K contract ,so FII's added partial  long  in Index Futures and added  shorts in index futures.
As discussed yesterday Nifty is at a crucial juncture trading between 21/34 HEMA, crossing the same we can see move towards 8682/8713 odd levels. Gann Box is also suggesting supply zone in range of 8682-8713.   Holding 8590 bulls will have upperhand, below it bears will have upperhand and take sharp downmove till 8500/8455 odd levels. Low made was 8599 and..

Continue Reading

Trading Mantras to be successful trader

  • Seeing an opportunity and acting upon it are two different things.
•  Price has memory. Odds are what price did the last time it hit a certain level will be repeated  . . . (BR:  Until support or resistance fails).
•  Pay attention to price action, regardless of what the charts are saying.
•  Look for a reversal at the same place you’re expecting a breakout or breakdown.
•  Price action sets up against the majority; the best profits are often in the opposite direction of the way you’re planning to go.
• Add to your winners and cut your losers. ’nuff said.
•  Opportunities come along all of the time. Wait for the best ones.
•  Don’t overly anticipate or see things that aren’t there. Wait for your signals.
•  The day isn’t over until the clo


Continue Reading

BHEL,Bank India and CIPLA Elliot Wave Analysis

BHEL

BHEL
Holding 254 stock is heading back to 267/288.
Intraday traders use below mentioned levels

Buy above 258 Tgt..


Continue Reading

Nifty technical setup before crucial inflation /iip data

FII
  • FII's sold 12 K contract of Index Future worth 202 cores, 9.7 K Long contract were squared  off by FII's and 2.3 K  short contracts  were added by FII's. Net Open Interest decreased  by 7.3 K contract ,so FII's squared  off  long  in Index Futures and added  shorts in index futures.
Nifty is at a crucial juncture trading between 21/34 HEMA, crossing the same we can see move towards 8682/8713 odd levels. Gann Box is also suggesting supply zone in range of..
Continue Reading

Tuesday, February 10

Nifty ready for swift move in next 2 session, FII Data Analysis

FII
  • FII's sold 75.2 K contract of Index Future worth 1792 cores, 29.2 K Long contract were squared  off by FII's and 46 K  short contracts  were added by FII's. Net Open Interest increased  by 16.8 K contract ,so FII's squared  off  long  in Index Futures and added huge shorts in index futures.
Nifty corrected for seventh day in a row with correction of 520 points  and Bank Nifty has corrected 2500 points, Fall has been in straight line and its first time after 2000 when Nifty has corrected 7 days in a row. As per Gann Analysis 10/11 Feb are very important date and sharp and swift...
Continue Reading

Monday, February 9

Adani,HDIL and Yes Bank darvas box trading

Adani

Adani

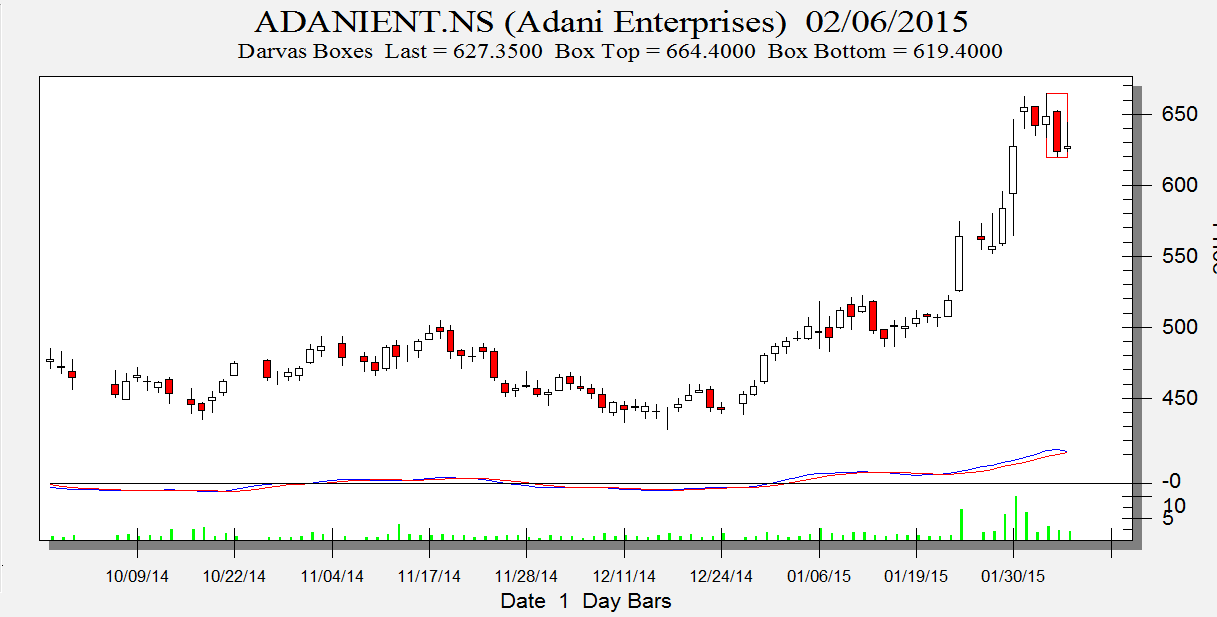
Holding 623 stock is heading back to 644 and 665.
Intraday traders use below mentioned levels

Buy above 632 Tgt..


Continue Reading

Sunday, February 8

Bank Nifty corrects 10%,Weekly Analysis

Last week we gave the Chopad level of 19856 Bank Nifty achieved 3 target on downside  . Lets analyze how to trade Bank Nifty in coming week as RBI policy is due.

 Bank Nifty Hourly

Bank Nifty Hourly
Bank NIfty hourly charts are approaching the demand zone as seen in hourly chart so range of 18600-18400 needs to be closely watched holding the same can see sharp and swift move on upside. Unable to do so can fall till 18000.

Bank Nifty Hourly  EW Daily

Bank Nifty Hourly EW
Hourly Elliot wave analysis is shown..

Continue Reading

AAP Exit Poll Effect,Will Stock Market form short term bottom

Last week we gave Chopad Levels  of 8806 Nifty did 2 target  on downside. We saw a roller coaster ride in last week with Nifty and Bank Nifty swinging wildly and both indices closing in red for 6 days in a row feat which was last achieved in 09-17 Dec 2013. Here is my analysis on How will market react to AAP win  Lets see how to trade nifty in coming week.

 Nifty Hourly Chart

nifty hourly
Nifty Hourly charts has broken its both 21/34 HEMA as nifty was unable to cross its trendline resistance, Now nifty is at crucial support of 8630/8590 , breaking the same correction can run deep, able to hold another attempt will me made for 8840/new highs.

 Nifty Hourly Elliot Wave Chart

Nifty Hourly EW
Elliot wave chart  on Hourly is shown..
Continue Reading

How will market react to AAP win

Many traders are asking How will market react to AAP win.
If we have to take any cues from History in 2013 when BJP won the 3 state election and Hung Assembly in Delhi  and formed short term top@ 6415 on 9 Dec 2013 and than corrected till 5933. Classic case of Buy Rumor Sell News
State Election

In Current Scenario Market was


Continue Reading

Saturday, February 7

How to Create a Psychological Journal

Keeping a trading journal with all your trades is good but at the end of day numbers are just gonna be numbers and they don’t really tell the whole story. If you’ve already caught yourself thinking that you’re doing “something” wrong over and over again but you don’t know what it is, maybe it’s time you start a psychological journal too!
You know how the market has tendencies? Well, in the same way that it tends to react to market events and environments in certain ways, individual traders also have repetitive reactions and behavioral tendencies. However, we often overlook them and how they may be affecting our trading performance.
See, through our lifetime we’ve developed coping mechanisms to help us deal with distress. For example, the first time you sipped your hot caramel macchiato a bit too quickly, you’ve learned that your tongue will burn and that it will probably happen again the next time you do it, right? To avoid pain, you’ve learned to sip slowly or waited for it to cool before drinking it. Eventually, coping mechanisms like these turn into habits and come off naturally

Continue Reading

Trade with Relative Strength Index (RSI)

What is an Oscillator
An oscillator is a leading technical indicator which fluctuates above and below a center line and normally has upper and lower bands which indicate overbought and oversold conditions in the market (an exception to this would be the MACD which is an Oscillator as well).
What is RSI
The RSI is best described as an indicator which represents the momentum in a particular Stock or Index  when it is reaching extreme levels to the upside (referred to as overbought) or downside (referred to as oversold) and is therefore due for a reversal. RSI Bands are  placed at 70 which is considered an extreme level to the upside, and 30 which is considered an extreme level to the downside.
RSI Calculation
100
RSI = 100 - --------
1 + RS
RS = Average Gain / Average Loss

This RSI calculation  is based on 14 periods, which is the default suggested by Wilder in his  book. Losses are expressed as positive values, not negative values.
The very first calculations for average gain and average loss are simple 14 period averages.
First Average Gain = Total of Gains during the past 14 periods / 14
First Average Loss = Total of Losses during the past 14 periods / 1
The second, and subsequent, calculations are based on the prior averages and the current gain loss:
Average Gain = [(previous Average Gain) x 13 + current Gain] / 14.
Average Loss = [(previous Average Loss) x 13 + current Loss] / 14.
Example of RSI
  • To Identify and potentially overbought Index/Stock


Continue Reading

FII FnO Data Analysis for 09 Feb

FII
  • FII's sold 29.6 K contract of Index Future worth 1180 cores, 25.9 K Long contract were squared  off by FII's and 3.6K  short contracts  were added by FII's. Net Open Interest decreased  by 22.4 K contract ,so FII's squared  off  long  in Index Futures and added partial shorts.
Nifty corrected for sixth day in a row and Bank Nifty has completed its 10% correction. Both these index are near important Fibonacci Ratio as seen in  below chart. Read this article after wild swing we saw in market last week How to Control Trading Stress


Continue Reading

Friday, February 6

How to Control Trading Stress

The last week in Stock Market has been a roller coaster ride which would have stressed traders a lot. Professional traders know what havoc can trading stress create in both professional and personal life, so trading stress needs to be controlled. Lets discuss few steps which will help in stress mitigation.
Controlling trader stress requires only a few simple steps. But you must also make a commitment to change bad trading habits and constantly monitor your behavior as a trader.
Every trader is different. Every trade is different. The market is constantly changing. This constant change can be a major source of stress for any trader. Most traders hold multiple open trades at any one time. The market is constantly changing and moving. Events happen: war, peace, elections, natural disasters, weather, and even holidays. Almost any event can affect the market and your trades. Change can be very stressful—all change even happy events. Every trader’s life is constantly full of change. Does that mean that a trader’s life is constantly full of stress? Not necessarily.

Three Steps to Controlling Stress


Continue Reading

Rel Cap,Maruti and REC positional trading analysis

Reliance Capital

rel Cap

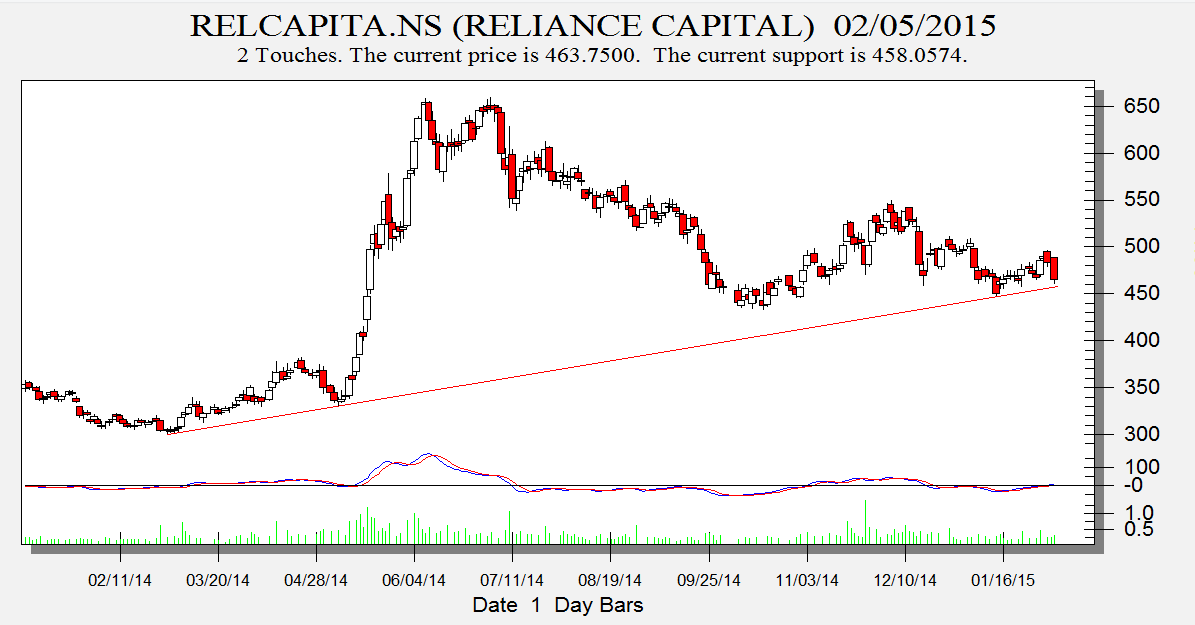
Any close above 466 stock is heading back to 500/521.
Intraday traders use below mentioned levels

Buy above 466 Tgt 470,475 and 481 SL 463

Sell below 460 Tgt 456,453 and 442 SL 463


REC

REC

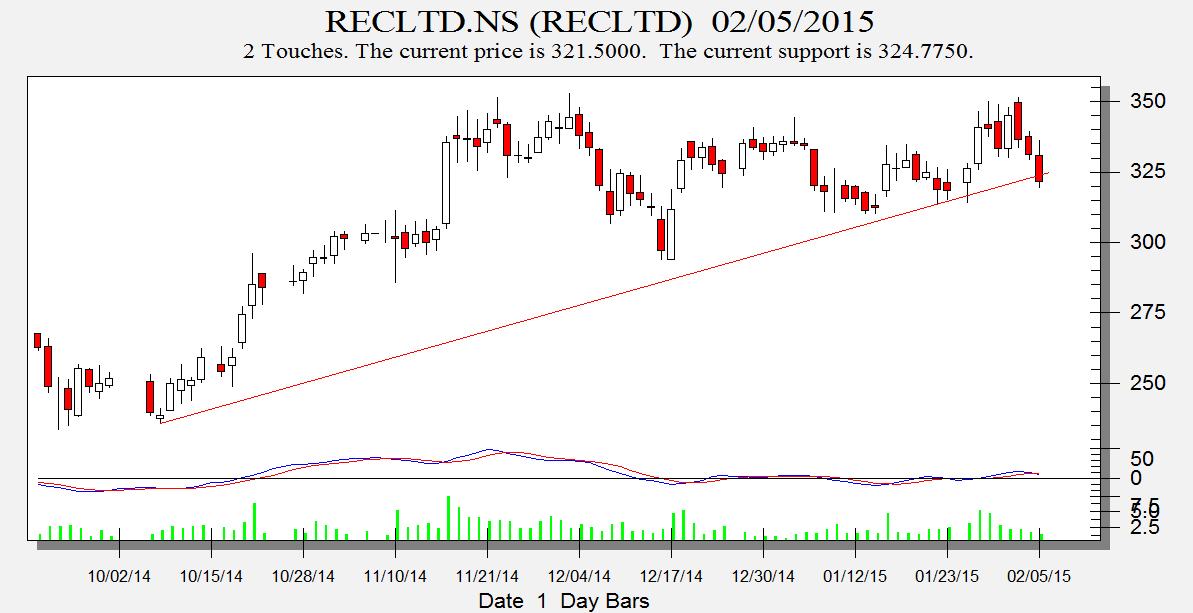
Any close above 322 stock is heading back to 343.
Intraday traders use below mentioned levels

Buy above 322 Tgt 325,328 and 332 SL 320

Sell below 319 Tgt 315,310 and 305 SL 321


Maruti

Maruti
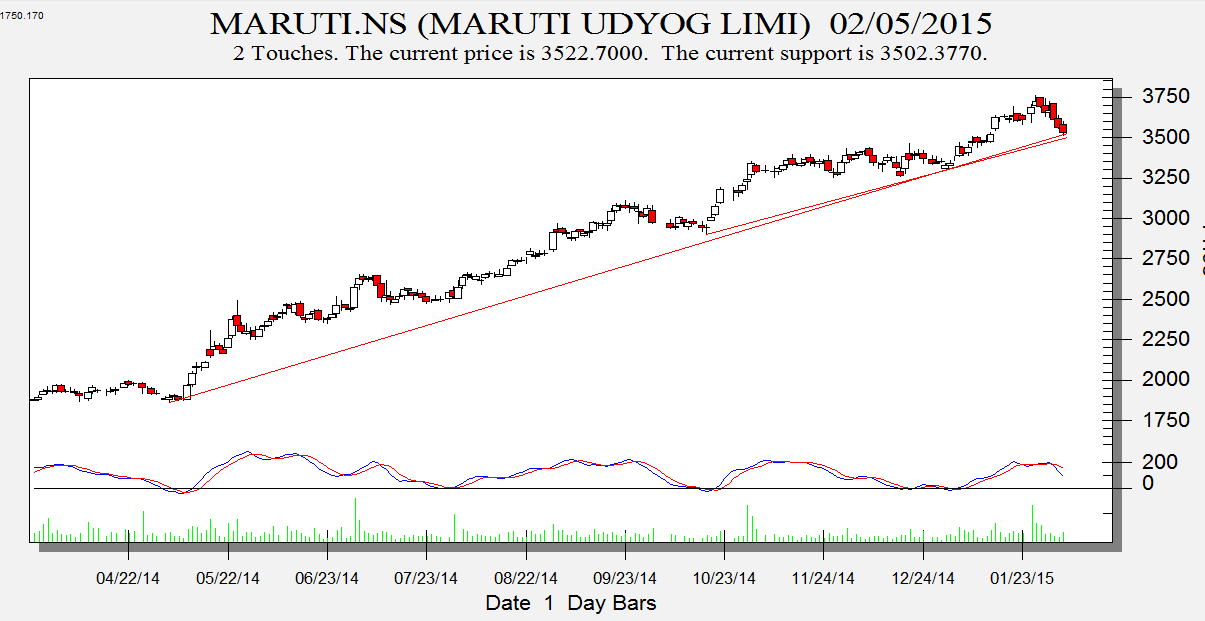
Closing above 3571 stock is heading to 3634/3704/3804
Intraday traders use below mentioned levels

Buy above 3543 Tgt 3571,3597 and 3631 SL 3522

Sell below 3508 Tgt 3500,3488 and 3460 SL 3522


How to trade Intraday and Positional Stocks Analysis  -- Click on this link


Performance sheet for Intraday and Positional is updated for December Month, Intraday Profit of 2.25 Lakh  and Positional Profit of 1.49 Lakh
http://tradingsystemperformance.blogspot.in/
http://stockpositionaltrading.blogspot.in/

  • All prices relate to the NSE Spot
  • Calls are based on the previous trading day's price activity.
  • Intraday call is valid for the next trading session only unless otherwise mentioned.
  • Stop-loss levels are given so that there is a level below/above, which the market will tell us that the call has gone wrong. Stop-loss is an essential risk control mechanism; it should always be there.
  • Book, at least, part profits when the prices reach their targets; if you continue to hold on to positions then use trailing stops to lock in your profits.

Follow on Facebook during Market Hours:  https://www.facebook.com/pages/Brameshs-Tech/140117182685863
Please also read the detailed Disclaimer mentioned in the Right side of Blog.
The post given here are My Personal views and for learning purpose, trading or investing in stocks is a high risk activity. Any action you choose to take in the markets is totally your own responsibility. I will not be liable for any, direct or indirect, consequential or incidental damages or loss arising out of the use of this information.

Thursday, February 5

Nifty shows wild swing,Analyzing FII Data Analysis


  • FII's sold 23.2 K contract of Index Future worth 575 cores, 23.5 K Long contract were squared  off by FII's and 343  short contracts  were squared  off   by FII's. Net Open Interest decreased  by 23.8 K contract ,so FII's squared  off  both shorts and long  in Index Futures.
  • Nifty corrected for fifth day in a row with wild swings happening in market, Nifty fall is lead by banks and bank nifty is near an important AF support as seen in bottom chart and nifty is not able to break the red line of gann box convincingly keeping both bulls and bears in state of confusion. Intraday volatility is also huge whipsawing traders on both side. As i always say in my article when unable to understand market moves better to stay out and sit on sidelines and protect your trading capital.As i discussed in my weekly analysis 5 is very important gann date and effect were seen with nifty 100+ up to -50 point giving a total 174 point move.


  • Nifty Future Feb Open Interest Volume is at 2.48 core with liquidation of 4.4 lakhs so bulls liquidated longs today in volatile session today.
  • Total Future & Option trading volume was   at 2.08 core with total contract traded at 5.7 lakh. PCR @0.94, as we expected last analysis relief rally can come
  • 9000  CE  OI at 50.8  lakh so wall of resistance @ 9000 .8800/8900 CE added 3.3  lakhs and 17 lakhs in 2 days so bears are holding shorts  , and creating resistance at higher levels. FII bought 23.8 K CE and 2 K shorted  CE were covered by them.
  • 8500 PE OI@ 29.7  lakhs so strong base @ 8500. 8700/8800 PE  added another 2.4 and 16 lakh in  OI  in 2 days so bulls are still holding on , next 2 days will be interesting as we will see trending move and one party will have to cover the positions.This kind of market are good for option writers. FII bought 13.3 K PE and 6.5 K PE were  shorted by them.
  • FII's sold 27 cores in Equity and DII bought 325 cores in cash segment.INR closed at 61.73.

Buy above 8740 Tgt 8776,8792 and 8828 (Nifty Spot Levels)

Sell below 8704 Tgt 8688,8652 and 8600 (Nifty Spot Levels)

Click Here to Like Facebook Page get Real time updates

Al Bank,Adani Port and Bata India ABCD pattern Analysis

Allahabad Bank


Holding 110 stock is heading back to 115/121 in short term.
Intraday traders use below mentioned levels

Buy above 111 Tgt 112.5,114.6 and 116.8 SL 110.4

Sell below 109 Tgt 108.2,106 and 104 SL 110


Bata India


Any close above 1364 stock is heading back to 1400/1453
Intraday traders use below mentioned levels

Buy above 1369 Tgt 1390,1403 and 1420 SL 1362

Sell below 1350 Tgt 1340,1320 and 1288 SL 1362


Adani Port


Any close above 322 stock is heading to 343

Intraday traders use below mentioned levels

Buy above 322 Tgt 324,328 and 333 SL 320

Sell below 319 Tgt 316,313 and 310 SL 321


How to trade Intraday and Positional Stocks Analysis  -- Click on this link


Performance sheet for Intraday and Positional is updated for December Month, Intraday Profit of 2.25 Lakh  and Positional Profit of 1.49 Lakh
http://tradingsystemperformance.blogspot.in/
http://stockpositionaltrading.blogspot.in/

  • All prices relate to the NSE Spot
  • Calls are based on the previous trading day's price activity.
  • Intraday call is valid for the next trading session only unless otherwise mentioned.
  • Stop-loss levels are given so that there is a level below/above, which the market will tell us that the call has gone wrong. Stop-loss is an essential risk control mechanism; it should always be there.
  • Book, at least, part profits when the prices reach their targets; if you continue to hold on to positions then use trailing stops to lock in your profits.

Follow on Facebook during Market Hours:  https://www.facebook.com/pages/Brameshs-Tech/140117182685863
Please also read the detailed Disclaimer mentioned in the Right side of Blog.
The post given here are My Personal views and for learning purpose, trading or investing in stocks is a high risk activity. Any action you choose to take in the markets is totally your own responsibility. I will not be liable for any, direct or indirect, consequential or incidental damages or loss arising out of the use of this information.

Wednesday, February 4

Nifty whipsawing traders, trending move round the corner


  • FII's bought 6.7 K contract of Index Future worth 220 cores, 10 K Long contract were squared  off by FII's and 16.8 K  short contracts  were squared  off   by FII's. Net Open Interest decreased  by 26 K contract ,so FII's squared  off  both shorts and long  in Index Futures.
  • Nifty corrected for fourth day in a row but momentum is missing on downside, Nifty fall is lead by banks and bank nifty is near an important AF support as seen in bottom chart and nifty is not able to break the red line of gann box convincingly keeping both bulls and bears in state of confusion. Intraday volatility is also huge whipsawing traders on both side. As i always say in my article when unable to understand market moves better to stay out and sit on sidelines and protect your trading capital.


  • Nifty Future Feb Open Interest Volume is at 2.52 core with liquidation of 1.15 lakhs so bears covered shorts today in volatile session today.
  • Total Future & Option trading volume was   at 1.72  core with total contract traded at 3.9 lakh. PCR @0.88,PCR has come to its lower end suggesting relief rally can be seen in next 2 days if 8720 is held.
  • 9000  CE  OI at 53.7  lakh so wall of resistance @ 9000 .8800/8900 CE added 6.4  lakhs so bears have started shorted 8800/8900 CE tune of 14 lakh, and creating resistance at higher levels but writers will have test in next 2 days. FII sold 4.1 K CE and 9.7 K CE were shorted  by them.
  • 8500 PE OI@ 29.8  lakhs so strong base @ 8500. 8700/8800 PE  added 14 lakh in OI so bulls are still making ground , next 2 days will be interesting as we will see trending move and one party will have to cover the positions.This kind of market are good for option writers. FII bought 31 K PE and 1.3 K PE were  shorted by them.
  • FII's sold 83 cores in Equity and DII sold 72 cores in cash segment.INR closed at 61.73.

Buy above 8740 Tgt 8776,8792 and 8828 (Nifty Spot Levels)

Sell below 8704 Tgt 8688,8652 and 8600 (Nifty Spot Levels)

Click Here to Like Facebook Page get Real time updates

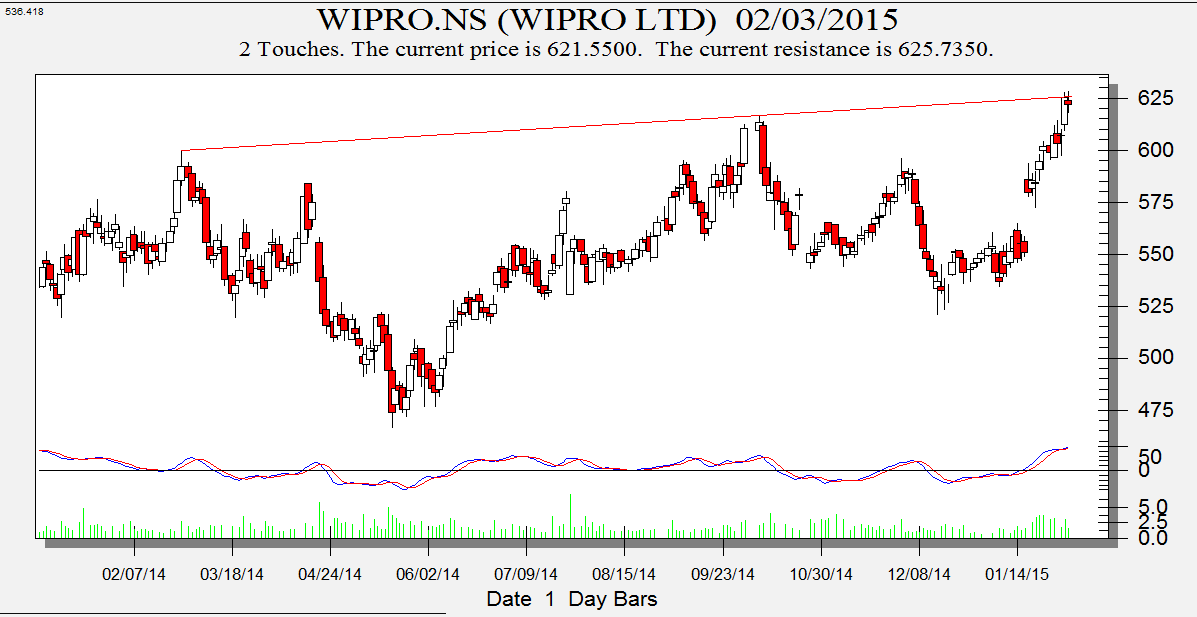
Wipro,ZEE and DRL trading plan

Wipro

Wipro
Any close above 623 stock is heading to 631/644.
Intraday traders use below mentioned levels

Buy above 623 Tgt 627,631 and 637 SL 620

Sell below 616 Tgt 612,606 and 600 SL 620

DRL

DRL
Intraday traders use below mentioned levels

Buy above 3094 Tgt 3110,3135 and 3156 SL 3087

Sell below 3080 Tgt 3068,3049 and 3024  SL 3087

ZEE


Any close above 377 stock is heading to 385/390 and 398
Intraday traders use below mentioned levels0

Buy above 374 Tgt 375.7,378 and 381 SL 372

Sell below 371 Tgt 369,366 and 364 SL 372.5


How to trade Intraday and Positional Stocks Analysis  -- Click on this link


Performance sheet for Intraday and Positional is updated for December Month, Intraday Profit of 2.25 Lakh  and Positional Profit of 1.49 Lakh
http://tradingsystemperformance.blogspot.in/
http://stockpositionaltrading.blogspot.in/

  • All prices relate to the NSE Spot
  • Calls are based on the previous trading day's price activity.
  • Intraday call is valid for the next trading session only unless otherwise mentioned.
  • Stop-loss levels are given so that there is a level below/above, which the market will tell us that the call has gone wrong. Stop-loss is an essential risk control mechanism; it should always be there.
  • Book, at least, part profits when the prices reach their targets; if you continue to hold on to positions then use trailing stops to lock in your profits.

Follow on Facebook during Market Hours:  https://www.facebook.com/pages/Brameshs-Tech/140117182685863
Please also read the detailed Disclaimer mentioned in the Right side of Blog.
The post given here are My Personal views and for learning purpose, trading or investing in stocks is a high risk activity. Any action you choose to take in the markets is totally your own responsibility. I will not be liable for any, direct or indirect, consequential or incidental damages or loss arising out of the use of this information.

Tuesday, February 3

FII FnO Data Analysis for 04 Feb

FII
  • FII's sold 16.3 K contract of Index Future worth 474 cores, 10.4 K Long contract were squared  off by FII's and 5.9 K  short contracts  were added  by FII's. Net Open Interest decreased  by 4.4 K contract ,so FII's added shorts in Index Futures mostly in Bank Nifty.
  • Nifty had a volatile session of trade after RBI maintained status quo, Now as per gann box nifty is at crucial juncture and expect a good trending move in next 2 sessions.


  • Nifty Future Feb Open Interest Volume is at 2.53 core with addition of 4.2 lakhs so bears added shorts today.
  • Total Future & Option trading volume was   at 2.11  core with total contract traded at 4.8 lakh. PCR @0.80,PCR has come to its lower end suggesting relief rally can be seen in next 2 days if 8720 is held.
  • 9000  CE  OI at 54.8  lakh so wall of resistance @ 9000 .8800/8900 CE added 7.6  lakhs so bears have started shorted 8800/8900 CE, and creating resistance at higher levels but writers will have test in next 2 days. FII bought 22.8 K CE and 13.5 K CE were shorted  by them.
  • 8500 PE OI@ 28.4  lakhs so strong base @ 8500. 8500/8800 PE  added 7.8 lakh in OI so bulls are still making ground , next 2 days will be interesting as we will see trending move and one party will have to cover the positions. FII bought 31.4 K PE and 3.4 K PE were  shorted by them.
  • FII's sold 264 cores in Equity and DII sold 137 cores in cash segment.INR closed at 61.67.

Buy above 8774 Tgt 8800,8821 and 8840 (Nifty Spot Levels)

Sell below 8751 Tgt 8730,8706 and 8662 (Nifty Spot Levels)

Click Here to Like Facebook Page get Real time updates

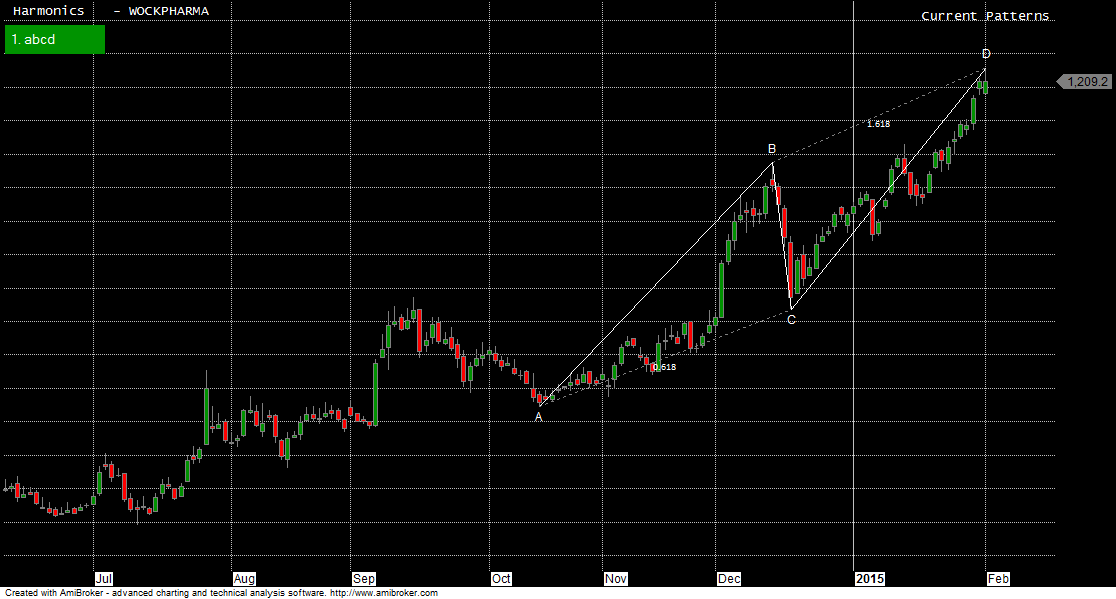
Wockpharma,IDFC and Dabur harmonic pattern

Wockpharma

Wock Pharma
Positional traders should look for close above 1230 for short term target of 1260/1300. Closing below 1200 stock is heading to 1131.
Intraday traders use below mentioned levels

Buy above 1212 Tgt


Continue Reading

Monday, February 2

FII FnO Data Analysis before RBI event

FII
  • FII's sold 5 K contract of Index Future worth 3.39 cores, 11.9 K Long contract were off by FII's and 6.8 K  short contracts  were squared  off  by FII's. Net Open Interest decreased  by 18.8 K contract ,so FII's squared off both longs and shorts before the RBI event.
Nifty after bearish engulfing pattern yesterday failed to do any follow up and formed a perfect DOJI candlestick pattern before the RBI event. Nifty held on to 8751 as discussed in weekly analysis  and showed intraday rally but got sold into. Nifty is trading below its 21/34 HEMA so bull will become active only above 8840 and bear will start making move below 8750, within the range choppy mode and trending move on break of this range.
Continue Reading

Sunday, February 1

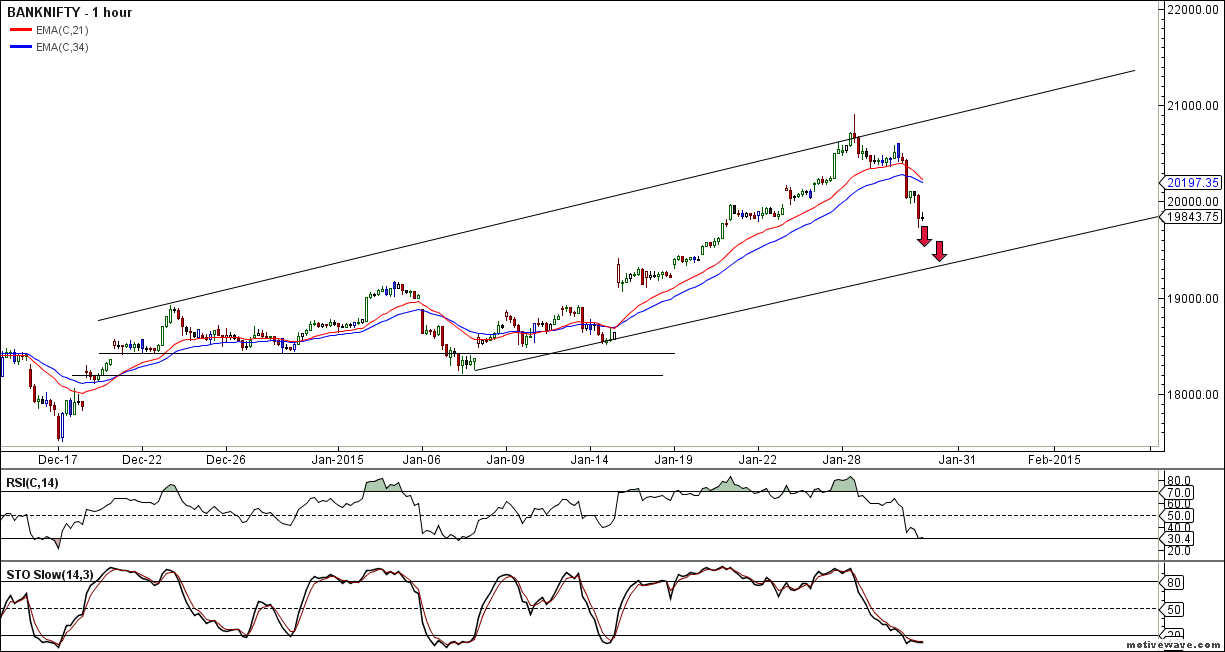
Bank Nifty Weekly Analysis for 02-06 Feb

Last week we gave the Chopad level of 20116 Bank Nifty achieved 3 target on upside and 2 target on downside  rewarding trend followers by 780 points.  . Lets analyze how to trade Bank Nifty in coming week as RBI policy is due.

 Bank Nifty Hourly

Bank Nifty Hourly
As discussed last week new high came and Bank Nifty went above upper trend line of channel and than gave a fast and swift move on gann turn date. Now bank nifty is heading towards lower end of channel once 19732 is broken towards 19300 odd levels.

Bank Nifty Hourly  EW Daily

Bank Nifty Hourly EW
Hourly Elliot wave analysis is shown,
Continue Reading