Tuesday, March 31

Nifty Reacts from Gunner arc, FII FnO Data Analysis

FII
  • FII's bought 20.8 K contract of Index Future worth 587 cores,21.5 K Long contract were added by FII's and 0.06 K short contracts  were added by FII's. Net Open Interest increased  by 22.2  K contract. Qualities which define a Successful Traders we discussed qualities of trader, implement these qualities in your trading.
This is what we discussed yesterday Nifty after 7 days of decline showed a rise of 150 points, Nifty closed above the last swing low of 8470 and is now entering the difficult resistance zone of 8535-8555 where we have trendline resistance,pyrapoint resistance and also 100 SMA. Price action in this zone will suggest the further course of action. Also as per gunner chart, we are heading towards important gann line support and green arc. Nifty formed high of 8550 and corrected almost 100 points from the highs. Gunner chart..


Continue Reading

Qualities which define a Successful Traders

One of the most interesting aspects of working as a trading coach is the ability to see, first hand, what contributes to the success of traders. So often the factors that lead to success are not those emphasized in mainstream articles and books. Here are two unappreciated virtues I see among successful portfolio managers and traders:
1) The ability to tolerate uncertainty - Every trader at certain point of time uncertainty ,where due to violent market moves gets confused which side to trade. Its how you trade in this uncertain period will decide whether you will be successful trader  or  will end up being a loser.
Professional traders aviod such uncertain times In such uncetain situation, the modal opinion of any trader should be "I don't know". Uncertainty is itself a view and, in fact, should be one's base case. When a trader cannot tolerate uncertainty and needs to manufacture conviction, the result inevitably is over trading the objective opportunity set. It is impossible to properly manage risk
Continue Reading

LT,Ranbaxy and DLF pyrapoint analysis

LT

LT
Positional traders should look for close above 1741 for short term target of 1800/1830 .
Intraday Traders can use the below mentioned levels

Buy above 1734 Tgt..


Continue Reading

Nifty shows trend reversal or dead cat bounce, FII FnO Data Analysis

FII
  • FII's sold 16 K contract of Index Future worth 227 cores,12.7 K Long contract were squared off by FII's and 3.3 K short contracts  were added by FII's. Net Open Interest increased  by 9.3 K contract.
Nifty after 7 days of decline showed a rise of 150 points, Nifty closed above the last swing low of 8470 and is now entering the difficult resistance zone of 8535-8555 where we have trendline resistance,pyrapoint
Continue Reading

Monday, March 30

Are you a good risk manager ?

Trading is not really about prediction or being right or wrong. It is really about how much are you willing to risk to find out. It’s easy to take the approach of, ‘is this trade going to work or not’, and in reality, we can’t help but think that way on a certain level. But because we will never know before hand, and because protecting capital is rule number one, we must attend to risk management and have flexible expectations instead of thinking in terms of ‘prediction’.

A set-up with a 50% win rate does not mean that the next 6 out of 10 trades will be winners . An objective market statistic based upon the past can not become a market probability about the future unless the same exact market participants are present and continue to act in the same way. Each trade, and each moment in the market, is unique for this reason.
The main point
Continue Reading

Jubilant Food,AB Nuvo and Ambuja Cement Swing trading analysis

Jubilant Food

Jubilant
Positional traders should look for close above 1510 for short term target of 1542 /1563.
Intraday Traders can use the below mentioned levels

Buy above 1511 Tgt


Continue Reading

FII FnO Data Analysis for 30 March

FII
  • FII's bought 7.5 K contract of Index Future worth 392 cores,12.4 K Long contract were squared off by FII's and 20 K short contracts  were squared off  by FII's. Net Open Interest decreased  by 32.4 K contract.
  • Nifty Charts  are updated in  Weekly Analysis  please read that to see the action in coming week Gann box is holding red line which is positive for bulls and follow up move should be seen in coming week.
NIFTY - Gann Box
Nifty April Future Open Interest Volume is at..


Continue Reading

Sunday, March 29

Bank Nifty breaks its Andrew pitchfork Support, Weekly Analysis

Last week we gave the Chopad level of 18686 Bank Nifty achieved 3 target on upside made low of 18688 and Chopad level was 18686.Lets analyze how to trade next week.

 Bank Nifty Hourly

Bank Nifty Hourly
Bank Nifty is entering  in 2 Demand zones are marked in above chart, 18500 and 18300 respectively.

Bank Nifty Hourly  EW Daily

Bank Nifty Hourly EW
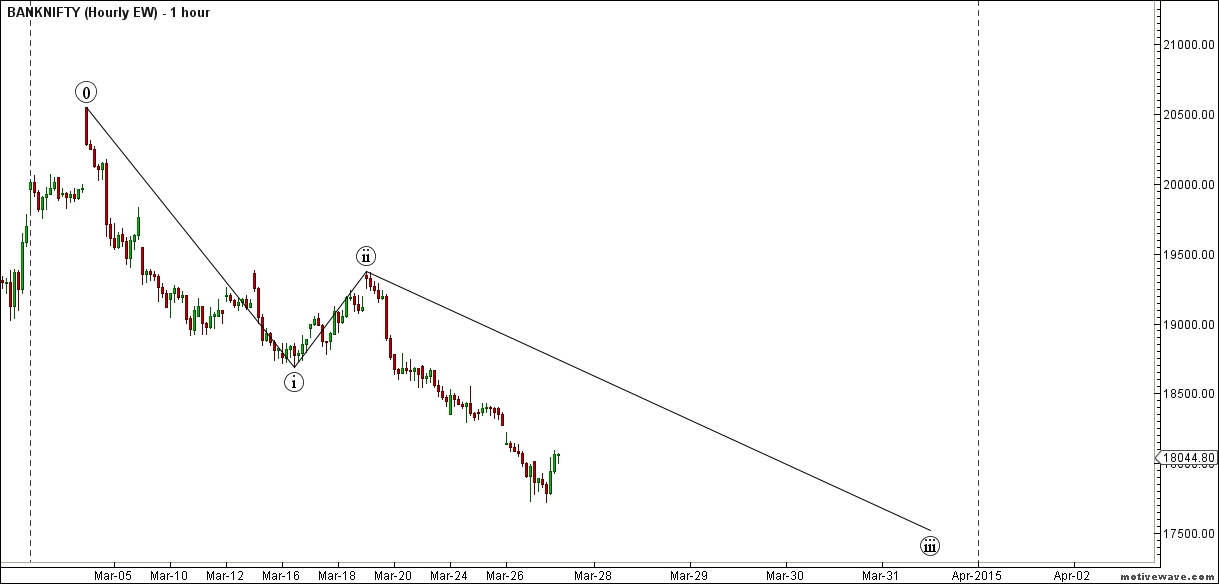
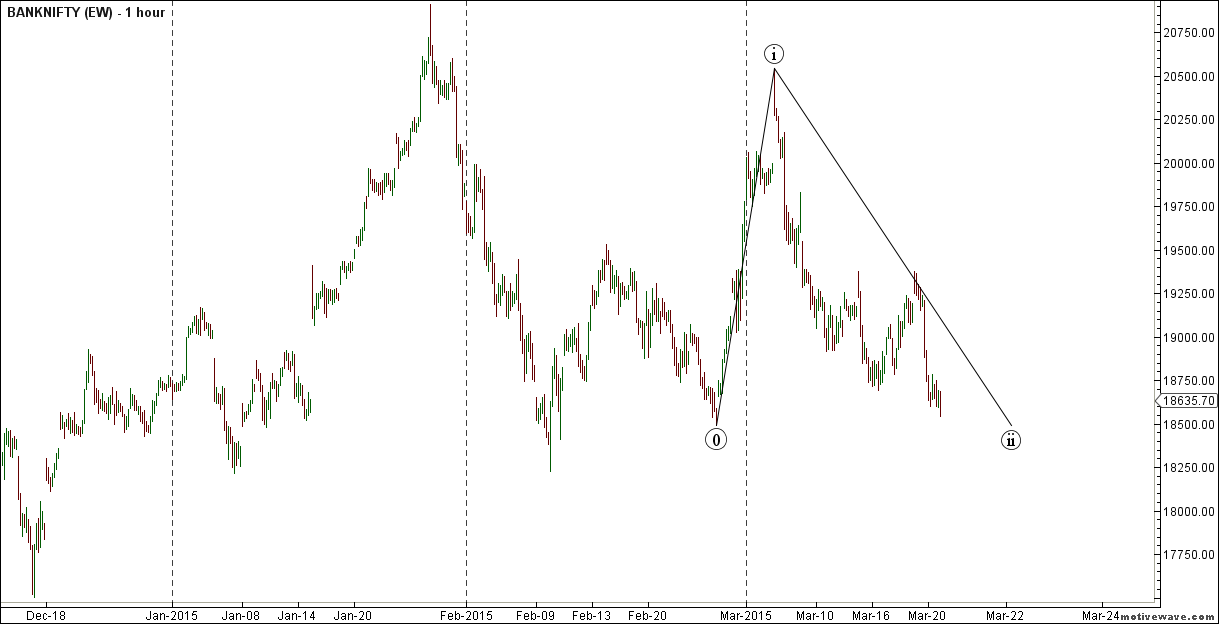
Hourly Elliot wave analysis is shown,17700  will play crucial role in coming week.

Bank Nifty Pyrapoint Indicator

BANKNIFTY - Pyrapoint

Continue Reading

Nifty breaks its 20WSMA, Weekly Analysis

Last week we gave Chopad Levels  of 8595  ,did all 3  target on downside and breaking its 100 DMA.  Lets analyze how to trade last week of financial year.

 Nifty Hourly Chart

nifty hourly
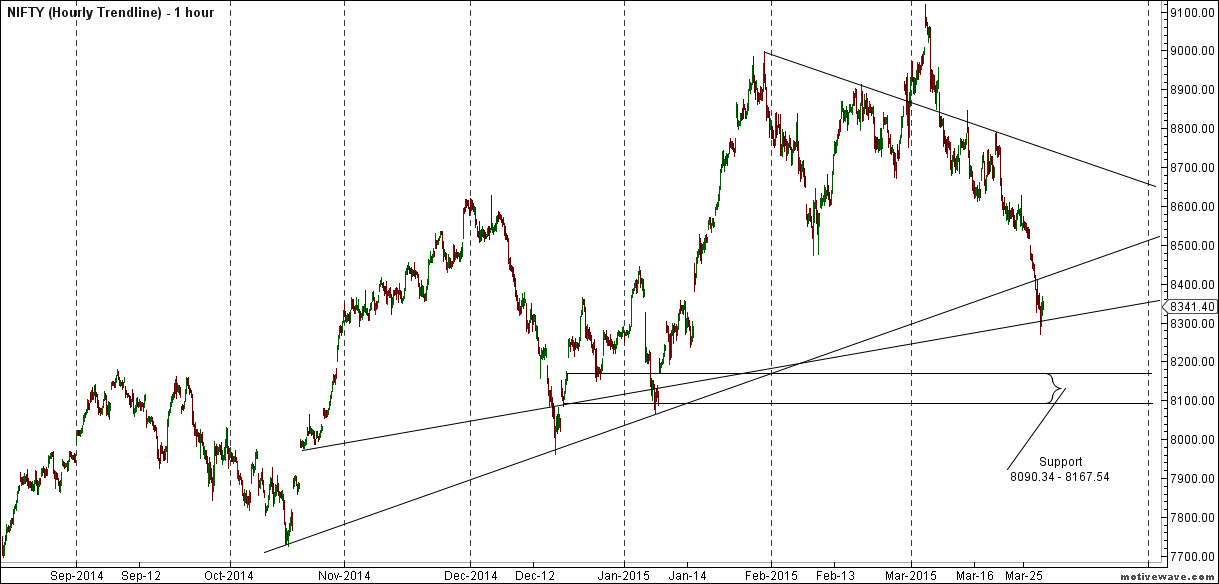
Nifty Hourly charts is near its trendline support and trading well below 21/34 EMA, any break of..

Continue Reading

Saturday, March 28

Questionnaire for Traders

The following questionnaire asks you to assess your emotional experience during your trading. Specifically, you’ll be rating how often you’ve experienced the following feelings over the past two weeks. Below, I’ll explain how to score the questionnaire; please complete the items before looking at the scoring. My next post will explain how to interpret your results.
Please use the following scale for your responses:
1 = rarely
2 = occasionally
3 = sometimes
4 = often
5 = most of the time
1) I feel happy when I’m trading _____
2) I feel stressed when I’m trading

Continue Reading

Friday, March 27

The training of a stock trader is like a medical education

“The physician has to spend long years learning anatomy, physiology, material medical and collateral subjects by the dozen.
“He learns the theory and then proceeds to devote his life to the practice. He observes and classifies all sorts of pathological phenomena. He learns to diagnose. If his diagnosis is correct – and that depends upon the accuracy of his observation – he ought to do pretty well in his prognosis, always keeping in mind, of course, that human fallibility and the utterly unforeseen will keep him from scoring 100 percent of bull’s-eyes.
And then, as he gains in experience, he learns not only to do the right thing but to do it instantly, so that many people will think he does it instinctively. It really isn’t automatism. It is that he has diagnosed the case according to his observations of such cases during a period of many years; and, naturally, after he has diagnosed it, he can only treat it in the way that experience has taught him is the proper treatment.”
“You can transmit knowledge-that is, your particular collection of card-indexed facts-but not your experience. A man may know what to do and lose money – if he doesn’t do it

Continue Reading 

Adani Ports,PFC and ONGC Technical Analysis

Adani Ports

Adani Port

Intraday Traders can use the below mentioned levels

Buy above 308 Tgt...


Continue Reading

Thursday, March 26

Nifty breaks trendline support, What next ?

FII
Nifty closed below its 100 DMA and below its trendline support. As per Pyrapoint Analysis Nifty broke its 180 degree line and than no attempt was made to move above 180 degree line and nifty declined towards its 225 degree and closing well below it. So for the first time we are breaking trendline, next technical support for market is 200 DMA. Till today's high is not crossed their is high probability we can visit 200 DMA. Gunner also shows
Continue Reading

Interview with Jesse Livermore

Conducted by Edwin Lefevre, dated circa 1922, this “interview” reveals great insights into the mind of the famous trader. As we will see, the wisdom imparted here could change our entire perspective on the speculative game we love and enjoy. It might even change our lives. I took the liberty of editing it due to its length.
Lefevre: Hello Mr Livermore. Thank you for taking the time to conduct this series of interviews with me. It is my understanding that you do not grant many interviews, so I am honored.
Livermore: You are very welcome. I appreciate the respect but you do not have to address me as Mr. Jesse, or my nickname, the boy plunger, will suffice.
Lefevre: And where did you get the name boy plunger?
Livermore: It was during the early days when I was trading small lots in the bucket shops, where the man who traded in twenty shares at a clip was suspected of being J.P. Morgan traveling incognito. I didn’t have a following. I kept my business to myself. As it was, it did not take long for the bucket shops to get sore on me for beating them. I’d walk in and plank down my margin, but they’d look at it without making a move to grab it. They’d say nothing doing. That is when they started calling me the boy plunger. I had to move from shop to shop, even to the point of changing my name. I couldn’t put trades on without getting cheated on the quotes.

Continue Reading

Wednesday, March 25

The Hidden Variable in Your Trading Success

Most traders realize that trading involves a lot of psychology. And most traders readily admit that a significant portion of their trading losses, or lack of performance, is due to “psychology”. Although the term ‘psychology’ isn’t always mentioned as an explanation, you can see it easily enough in the following statements ”I froze just as I was about to pull the trigger” ”I hesitated and missed that trade and was so pissed that I got myself into an impulse trade right after”….. “That large loss was not what I wanted, I held it thinking it would come back because last time I bailed out of this type of trade I got stopped out right before it reversed”….. “I was really nervous about losing money again so I got out of my winning trade way before my target”
Those are four common examples of trading psychology issues manifesting in one’s trading. Do you recognize yourself in the above statements?
All four of those statements have in common one thing, fear. Whether it’s the fear of not being perfect, the fear of being wrong, fear of losing money, fear of missing out, the fear of not being approved by others, or some other fear, the common theme is fear. Most trading mistakes

Continue Reading

Al Bank,Maruti and Tata Motors Harmonic Pattern Analysis

Allahabad Bank

ALBK

Holding 97 stock will bounce till 102/105.
Intraday Traders can use the below mentioned levels

Buy above 99.8 Tgt..


Continue Reading

Tuesday, March 24

Nifty forms gravestone doji,FII FnO Data Analysis

FII
  • FII's bought 27.5 K contract of Index Future worth 420 cores,43.9 K Long contract were added  by FII's and 16.4 K short contracts  were added  by FII's. Net Open Interest increased  by 60.4 K contract.
As discussed in Weekly Analysis Gann date showed its effect today with market being extremely volatile and closed forming a gravestone doji formation.  As per Pyrapoint Analysis Nifty Opened nifty is entering the support zone of 180 degree and rallied but closed below the blue line. Today low will become extremely crucial till expiry. Holding the same Nifty can see rally till 8700/8750 by expiry, as shown in Gunner chart.  Gann Box


Continue Reading

Stocks near 200 DMA:ICICI,SBI and Century

ICICI Bank

ICICI Bank

Holding 307 stock can bounceback till 322/330 again.
Intraday Traders can use the below mentioned levels

Buy above 316.5 Tgt


Continue Reading

Monday, March 23

Nifty near Gunner support, FII FnO Data Analysis

FII
  • FII's sold 17.9 K contract of Index Future worth 427 cores,13.5 K Long contract were squared off by FII's and 4.3 K short contracts  were added  by FII's. Net Open Interest decreased  by 9.2 K contract.
As per Pyrapoint Analysis Nifty Opened nifty is entering the support zone of 180 degree and holding well above its red line.  Gann Box also suggests we are entering a support zone and shorts should be cautious. Also Gunner in the second chart suggests we are nearing the sell target, so profit booking in shorts should be done. We can see another round of decline


Continue Reading

Different Stages of Trading

There are very predictable stages in any traders trading cycle.They are as under :1) Total beginner stage : We all started with this stage,we make some money on stocks or Options bought on tips and recommendations of someone and feel that this is a good way of earning some extra income,quick and easy money but soon we get disillusioned as some tips fail and we are left with holding some worthless stock and most of Options expires worthless ,then we decide that we must make our own study and make our own decisions.
2) Holy Grail Indicator/method stage :Then comes a stage in which we desperately go after books,new indicators,Metastock,Amibroker,RSI,ROC,MACD etc .We are fully convinced that out there there is some secret formula,some magical indicator or some key to trading riches and if we manage to find out that we will make it in trading this search continues for long time and we finally realize that there is no holy grail or a super indicator which will never fail.This is a stage where one believes that to be successful you need to have contacts with operators,inside information,market movers etc
3) Making Money

Continue Reading

Axis Bank,HDIL and Adani Gunner Analysis

HDIL


Axis Bank

Holding 97 stock will bounce back till 102/110.
Intraday Traders can use the below mentioned levels

Buy above 100 Tgt..


Continue Reading

Bank Weekly Analysis for March Expiry

Last week we gave the Chopad level of 18686 Bank Nifty achieved 3 target on upside made low of 18688 and Chopad level was 18686.Lets analyze how to trade next week.

 Bank Nifty Hourly

Bank Nifty Hourly
Bank Nifty is entering  in 2 Demand zones are marked in above chart, 18500 and 18300 respectively.

Bank Nifty Hourly  EW Daily

Bank Nifty Hourly EW
Hourly Elliot wave analysis is..

Continue Reading

Sunday, March 22

Nifty Weekly Analysis for March Expiry

Last week we gave Chopad Levels  of 8595  Nifty did not reach chopad levels for most part of week and it did on Friday and did 1 target on downside.  Lets analyze how to trade next week which is also Expiry for March Series.

 Nifty Hourly Chart

nifty hourly
Nifty Hourly charts is near its trendline support and trading well below 21/34 EMA, and is entering the demand zone and should be used by traders to cut down shorts. 8500/8470 is demand zone. As mentioned last week If we draw 16x1 gann line as shown in above chart support comes in range of 8542-8555 Nifty. Low made was 8553 on Nifty

 Nifty Hourly Elliot Wave Chart

Nifty Hourly EW

Continue Reading

FII FnO Data Analysis for 23 March

FII
  • FII's sold 26 K contract of Index Future worth 575 cores,8.8K Long contract were squared off by FII's and 17.1 K short contracts  were added  by FII's. Net Open Interest increased  by 8.3  K contract.
As per Pyrapoint Analysis Nifty Opened nifty is entering the support zone of 180 degree and holding well above its red line.  Gann Box also suggests we are entering a support zone and shorts should be cautious. Also Gunner in the second chart suggests we are nearing the sell target, so profit booking in shorts should be done. We can see another round of decline if 8550 on Nifty is broken , if not we can see a fast and swift bullish move above 8600..
Continue Reading

Saturday, March 21

Who Controls the market ? FII/DII or Others - A Statistical Analysis

This is in continuation of the article “Impact of Institutional Investments on NIFTY” published last week. Data and suggestions compelled me to analyses further with FII trading as focus area. Will analyzing the mystery of FII alone throw clues in finding our way in market maze? What will you think, if you take a closer look at the pie chart below :
Daily Turnover
The above chart is based on average of daily turnover in NSE since April 2012 to Feb 2015.
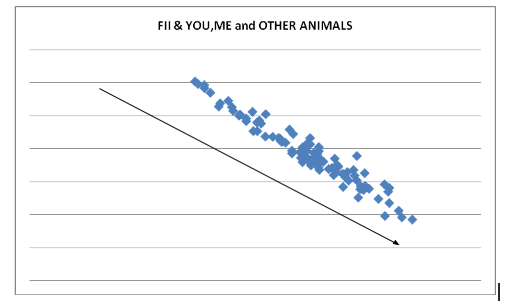
Still not convinced to read further? Then take this. Majority of You, me and the other animals (bulls, bears…) who contribute to the second major share of daily turnover, trade against the big boys.  Now, does it sound familiar read with the market gospel that 10% of traders gain what 90% lose?  No exaggeration. The data shows existence of a very, very strong relationship between FIIs and the “Others” and the relationship is in OPPOSITE direction. This is deciphered by subjecting the daily trading data of the two segments to statistical analysis of correlation coefficient. It threw a correlation coefficient of -0.97 (negative) existing between the two. (Please refer to last week’s cited article to refresh your memory of this statistical tool). If the data is plotted to create a cluster chart, it creates the below chart.

Daily Turnover
FII turn over in X Axis and Others on Y, show that on majority times/trades, majority of You and Me trade against the FIIs – one reason for the busted trading accounts that we have missed so long? Why else the market savvy traders keep highlighting on what FIIs did yesterday? Let me be honest.
Continue Reading

Friday, March 20

Ed Seykota’s Trading Style Part-IV

In Continuation with previous 2 article
Ed Seykota’s Trading Style Part-I
Ed Seykota’s Trading Style Part-II
Ed Seykota’s Trading Style Part-III

Embrace Whipsaws
  • Trading Systems don’t eliminate whipsaws. They just include them as part of the process.
Do Not Predict Or Anticipate
  • A computer can follow a system and place orders without making predictions or feeling anticipation. Predictions and anticipations are objects you create. These objects may interfere with sticking to your system.
Take Care of Your Emotions
  • Sometimes I trade entirely off the mechanical part, sometimes I override the signals based on strong feelings, and sometimes I just quit altogether. The immediate trading result of this jumping around is probably breakeven to somewhat negative.
  • However, if I didn’t allow myself the freedom to discharge my creative side, it might build up to some kind of blowout. Striking a workable ecology seems to promote trading longevity, which is one key to success.
  • Gut feel is important. If ignored, it may come out in subtle ways by coloring your logic. It can be dealt with
    through meditation and reflection

Continue Reading

Harmonic Pattern Analysis:JP,PTC and Hero Moto

JP Associate

JP Associate

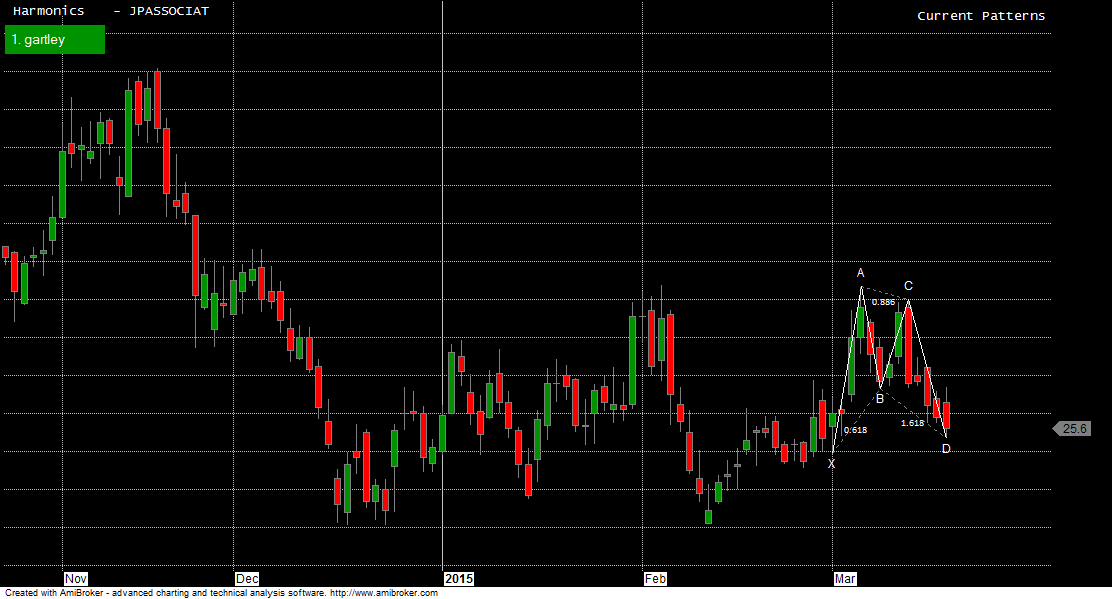
Any close above 26 stock will head again towards 29.
Intraday Traders can use the below mentioned levels

Buy above 25.8 Tgt..


Continue Reading

Nifty shows wild swing,FII FnO Data Analysis

FII
  • FII's bought 5.5 K contract of Index Future worth 170 cores,8.1K Long contract were added by FII's and 2.5 K short contracts  were added  by FII's. Net Open Interest increased  by 10.7 K contract.So again we got a volatile day which was used by FII's to buyer at lower level.
As discussed in Weekly Analysis we are in volatile cycle and it will be there till 27 March and same is experienced today also. As per Pyrapoint Analysis Nifty Opened above 135 degree line took resistance at red line as shown in below chart and once the blue line got broken saw fast and swift decline and is heading near the zone

Continue Reading

Thursday, March 19

Ed Seykota’s Trading Style Part-III

In Continuation with previous 2 article
Ed Seykota’s Trading Style Part-I
Ed Seykota’s Trading Style Part-II
Risk Below 5% of Equity Per Trade
  • I intend to risk below 5% on a trade, allowing for poor executions. Occasionally I have taken losses
    above that amount when major news caused a thin market to jump through my stops.
  • Risk no more than you can afford to lose, and also risk enough so that a win is meaningful. If there is no such amount, don’t play.
  • Speculate with less than 10% of your liquid net worth. Risk less than 1% of your speculative account on a trade. This tends to keep the fluctuations in the trading account small, relative to net worth. This is essential as large fluctuations can engage Fred and lead to feeling-justifying drama.
  • Betting more boldly produces more volatility. Good traders are familiar with both and keep their trading well within their tolerances.
  • I use a rule of thumb that you place less t

Continue Reading

Price Channel Analysis:Sun Pharma,HDFC Bank and CESC

Sun Pharma

Sun Pharma

Any close below 1040 short term target 1021/1008/987.
Intraday Traders can use the below mentioned levels

Buy above 1051 Tgt..


Continue Reading

Dollar Flash Crashes after FOMC Statement

These days Currency trading has become dangerous, As Forex Market is highly leveraged so even a small move of 1% can see big move in your trading account.

After US FOMC Statement and more dovish Janet Yellen US Dollar crashed from 99.5 to 96.5 and EURO rose USD JPY crashed sub 119 all represented in below chart.
The Dollar flash-crashed after Dovish statement from US Fed


Continue Reading

US Fed statement:More Dovish Than Expected

Information received since the Federal Open Market Committee met in January suggests that economic growth has moderated somewhat. Labor market conditions have improved further, with strong job gains and a lower unemployment rate. A range of labor market indicators suggests that underutilization of labor resources continues to diminish. Household spending is rising moderately; declines in energy prices have boosted household purchasing power. Business fixed investment is advancing, while the recovery in the housing sector remains slow and export growth has weakened. Inflation has declined further below the Committee's longer-run objective, largely reflecting declines in energy prices. Market-based measures of inflation compensation remain low; survey-based measures of longer-term inflation expectations have remained stable.
Consistent with its statutory mandate, the Committee seeks to foster maximum employment and price stability. The Committee expects that, with appropriate policy accommodation, economic activity will expand at a moderate pace, with labor market indicators continuing to move toward levels the Committee judges consistent with its dual mandate. The Committee continues to see the risks to the outlook for economic activity and the labor..
Continue Reading

Wednesday, March 18

FII FnO Data Analysis before FOMC statement

FII
  • FII's sold 26.8 K contract of Index Future worth 525 cores,23.5 K Long contract were squared off  by FII's and 3.3 K short contracts  were added  by FII's. Net Open Interest decreased  by 20.1 K contract.
After yesterday DOJI candlestick formation , Nifty formed an inside day candlestick today,  saw a volatile move today with bearish bias, before FOMC meeting. As discussed in Weekly Analysis we are in volatile cycle and it will be there till 27 March.  As per Pyrapoint Analysis Nifty yesterday Nifty has closed above the 135 degree line..
Continue Reading

Ed Seykota’s Trading Style Part-II

In Continuation With the Previous Ed Seykota’s Trading Style Part-I
Risk Below 5% of Equity Per Trade
  • I intend to risk below 5% on a trade, allowing for poor executions. Occasionally I have taken losses
    above that amount when major news caused a thin market to jump through my stops.
  • Risk no more than you can afford to lose, and also risk enough so that a win is meaningful. If there is no such amount, don’t play.
  • Speculate with less than 10% of your liquid net worth. Risk less than 1% of your speculative account on a trade. This tends to keep the fluctuations in the trading account small, relative to net worth. This is essential as large fluctuations can engage Fred and lead to feeling-justifying drama.
  • Betting more boldly produces more volatility. Good traders are familiar with both and keep their trading well within their tolerances.
  • I use a rule of thumb that you place less than 10% of your liquid net worth at risk and that you stop your losses at 50% of that – so you have net exposure of 5% of your liquid net worth. If you have a net worth of 1.5 million, you might have liquid net worth (cash, stocks, bonds, etc) of, say, about 500,000 (a wild guess). Then you might place $50,000 of that at risk and cut your loss if you lose $25,000.

Continue Reading

HDIL,Tata Motors and Coalgate Darvas Box Analysis

HDIL

HDIL

Holding 110 stock is heading back to 115/121.
Intraday Traders can use the below mentioned levels

Buy above 113.3 Tgt..


Continue Reading

Nifty saw volatile move, FII FnO Data Analysis

FII
  • FII's sold 21.8 K contract of Index Future worth 487 cores,21.1 K Long contract were squared off  by FII's and 608 short contracts  were added  by FII's. Net Open Interest decreased  by 20 K contract.
After yesterday consolidation with formation of DOJI candlestick, Nifty saw a volatile move today, Range for the day was just 120 points but nifty moved 300 points during the session. As discussed in Weekly Analysis we are in volatile cycle and it will be..
Continue Reading

Tuesday, March 17

Ed Seykota’s Trading Style Part-I

Ed Seykota’s Trading Style
  • My style is basically trend following, with some special pattern recognition and money management
    algorithms.
  • In order of importance to me are: (1) the long-term trend, (2) the current chart pattern, and (3) picking a good spot to buy or sell. Those are the three primary components of my trading. Way down in very distant fourth place are my fundamental ideas and, quite likely, on balance, they have cost me money.
  • I consider trend following to be a subset of charting. Charting is a little like surfing. You don’t have to know a
    lot about the physics of tides, resonance, and fluid dynamics in order to catch a good wave. You just have to be able to sense when it’s happening and then have the drive to act at the right time.
  • Common patterns transcend individual market behavior (my note: i.e. price patterns are similar across different markets).
Overall Rules
  • Trade with the long-term trend.
  • Cut your losses.
  • Let your profits ride.
  • Bet as much as you can handle and no more.
Buying on Breakouts
  • If I were buying, my point would be above the market. I try to identify a point at which I expect the market momentum to be strong in the direction of the trade, so as to reduce my probable risk.
  • I don’t try to pick a bottom or top.
  • If I am bullish, I neither buy on a reaction, nor wait for strength; I am already in. I turn bullish at the instant
    my buy stop is hit, and stay bullish until my sell stop is hit. Being bullish and not being long is illogical.
Only Exit When Stops

Continue Reading

Stocks Pyrapoint Analysis:Asian Paint,LT and PNB

Asian Paint

Asian Paint

Any close above 843 stock is heading to 898.
Intraday Traders can use the below mentioned levels

Buy above 836 Tgt


Continue Reading

Monday, March 16

Nifty Forms Doji pattern,FII FnO Data Analysis

FII
  • FII's sold 7.9 K contract of Index Future worth 139 cores,7.5 K Long contract were squared off  by FII's and 401 short contracts  were added  by FII's. Net Open Interest decreased  by 7.1 K contract.
After the Big fall on Friday,today was the perfect day of consolidation with formation of DOJI candlestick, As per Pyrapoint Analysis 135 degree line


Continue Reading

Jesse Livermore made $100 million in 1929. By 1934 he had lost it all

How could an experienced trader lose his entire fortune?
Why didn’t Jesse Livermore follow his own trading rules? – rules that should quickly have closed his losing positions.
In 1917, with great foresight, Jesse Livermore had bought $800,000 worth of annuities. His objective was to ensure his family had an income in case he lost everything in the markets. He knew from experience how strongly the market could pull on every last cent a trader had.
He said:
“The reason I did this was not alone the fear that the stock market might take it away from me, but because I knew that a man will spend anything he can lay his hands on. By doing what I did my wife and child are safe from me.
“More than one man
Continue Reading

LIC,BHEL and Bajaj Auto Harmonic Pattern Analysis

LIC Housing

LIC
Any close below 444 stock is heading to 432/411
Intraday Traders can use the below mentioned levels

Buy above 448 Tgt..


Continue Reading

Bank Nifty Forms Evening Star pattern,Weekly Analysis

Last week we gave the Chopad level of 19596 Bank Nifty achieved 3 target on downside .Lets analyze how to trade next week.

 Bank Nifty Hourly

Bank Nifty Hourly
Bank Nifty took support at the trendline @18750  and closed  near it. 2 Demand zones are marked in above chart, 18500 and 18300 respectively. Break and close below 18750 can see bank nifty moving to these 2 mentioned levels.

Bank Nifty Hourly  EW Daily

Bank Nifty Hourly EW
Hourly Elliot wave analysis is shown,18500 will play crucial role in coming week.

Bank Nifty Pyrapoint Indicator


Continue Reading

Sunday, March 15

Nifty Forms Evening Star pattern,Weekly Analysis

Last week we gave Chopad Levels  of 8936  Nifty opened at 8891 below chopad levels and  did 2 target on downside rewarding Chopad followers with 170 points. Last week is the biggest weekly loss for CY2015 . Lets analyze how to trade next week.

 Nifty Hourly Chart

nifty hourly
Nifty Hourly charts has broken its trendline support and trading well below 21/34 EMA,If we draw 16x1 gann line as shown in above chart support comes in range of..
Continue Reading

Saturday, March 14

Candlestick patterns Part-II

In Continuation of Previous article
Harami

The Harami pattern is a real small body that is contained within what the Japanese call an “unusually long black body or white real body.” “Harami” is an old Japanese word for pregnant. The Japanese nickname for the long candle is the “mother” candle and the small candle is the “baby” or “fetus.” The second candle of the Harami can be white or black. The Japanese will say that with a Harami the market is “losing its breath.” The sellers may be in control of this stock.


Harami

Continue Reading

Impact of institutional investment on NIFTY (FII & DII – NIFTY)

It is a generally accepted and recognized theory that FIIs and DIIs can influence the NIFTY. In this article an attempt is made to understand the impact made by the institutional investors since April 2006 to Feb 2015.
Purchases and Sales data of FIIs and DIIs in the past eight years since 2007-2008 (2014-15 till Feb) is given below:Impact of institutional investment on NIFTY (FII & DII – NIFTY)


Birds eye inferences from the above table are :
  • FII have remained “net purchasers” since 2009-10
  • DII have remained “net sellers” since 2010-11
It would be interesting to compare the above data with how NIFTY has performed during the check period. Given below is the April (open) to Mar (close) values for the period.


Continue Reading

Nifty closes below 50 SMA,FII FnO Data Analysis

FII
  • FII's sold 8.3 K contract of Index Future worth 5 cores,1.6 K Long contract were squared off  by FII's and 6.6K  short contracts  were added  by FII's. Net Open Interest increased  by 4.9 K contract.
As discussed in yesterday analysis, we thought Nifty has formed short term bottom and was ready to move up, Nifty opened gap up around 8849 and started moving down and closed well below 50 SMA, So Friday The 13 played its Role and rewarding Bears handsomely. Range of the day was 222 points. This is what we discussed today  As per gann box close above 2X1 line@8800 will add bullishness.  8820 should be watched closely tomorrow once crossed will add to bullish momentum as we have weekly closing.   As discussed yesterday Time Analysis shows big move round the corner we got 1
Continue Reading

Friday, March 13

The Four Mistaken Beliefs of Traders

ODDS ARE AGAINST YOU BEING A SUCCESSFUL TRADER

Sorry to burst your bubble but failure is the highest probable outcome for most in this business. Failure doesn't come because the markets are "rigged" or the belief that "they" are monitoring your odd lot trades to take the other side only to cause you pain in some nefarious conspiracy. No, the reason most people fail at trading comes from within.
Here are four of the most common beliefs of new traders that I've seen.

THE MARKETS ARE EASY

From the expectation of bouncing from trendline support or market is overbought should correct, Making millions doesn't get much easier than that, right? The only thing easy about the market is losing your trading capital.
The markets are not easy. What would you think if fresh MBBS graduate doctor will like to conduct surgery on you first time ? If you came into the markets thinking it's easy to make money you're wrong. Perhaps you were naive and you've had some success, great! Howeve


Continue Reading

Voltas,Havells and Auro Pharma ABCD Zig Zag pattern Analysis

Voltas

Voltas
Any close above 290 stock is heading to 300/310/322.
Intraday Traders can use the below mentioned levels

Buy above 290 Tgt..


Continue Reading

Thursday, March 12

Nifty forms short term bottom, How to trade next move

FII
  • FII's bought 5.7 K contract of Index Future worth 125 cores,0.4 K Long contract were added by FII's and 5.2K  short contracts  were squared off  by FII's. Net Open Interest decreased  by 4.8 K contract.
Nifty after yesterday inside bar pattern, did a gap up open and did not fill the gap and closed at highest point of the day.  On Hourly charts nifty held on to its hourly trendline, closed above its 21 EMA and knocking the door on close above 34 EMA.  As per gann box close above 2X1 line@8800 will add bullishness.


Continue Reading

Shark Harmonic Pattern Trading Analysis

GAIL

GAIL
Any close above 390 stock is heading to 398/411.
Intraday Traders can use the below mentioned levels

Buy above 390 Tgt..


Continue Reading

Why Jesse Livermore failed as Trader ?

“A stock operator has to fight a lot of expensive enemies within himself.”
– Jesse Livermore
As Old saying says Learn from the mistake of other so as you do not have to repent again. Jesse Livermore was a pioneer in the trading world. He was one of the very first trend traders, rule based discretionary traders, and traders of pure price action. He was a trail blazer as many consider his the best stock trader of all time. Fact is he committed suicide and died almost penniless. So what lead to the downfall of great traders of all time. Lets learn from this and apply in our trading so as to emerge as WINNERS.

  • Letting losers run: Many times he did not cut his losses. “I did precisely the wrong thing. The cotton showed me a loss and I kept it. The wheat showed me a profit and I sold it out. Of all the speculative blunders there are few greater than trying to average a losing game. Always sell what shows you a loss and keep what shows you a profit.” – Jesse Livermore

Lack of..

Continue Reading

Bank Of Korea Cuts Interest Rate, 24th Central Bank To Ease In 2015

The currency war salvos just keep on coming.
Following the surprise rate cut by Thailand earlier today, the "surprise" South Korean rate cut means there are now 24 easing policy actions by central banks in 2015 alone.
Here is the full list of the 24 central bank rate cuts so far in 2015:
1. Jan. 1 UZBEKISTAN
Uzbekistan's central bank cuts its refinancing rate to 9 percent from 10 percent.
2. Jan. 7/Feb. 4 ROMANIA
Romania's central bank cuts its key interest rate by a total of 50 basis points, taking it to a new record low of 2.25 percent. Most analysts polled by Reuters had expected the latest cut.
3. Jan. 15 SWITZERLAND
The Swiss National Bank stuns markets by scrapping the franc's three-year-old exchange rate cap to the euro, leading to an unprecedented surge in the currency. This de facto tightening, however, is in part offset by a cut in the interest rate on certain sight deposit account balances by 0.5 percentage points to -0.75 percent.
4. Jan. 15 EGYPT
Egypt's central bank makes a surprise 50 basis point cut in its main interest rates, reducing the overnight deposit and lending rates to 8.75 and 9.75 percent, respectively.
5. Jan. 16 PERU
Peru's central bank surprises the market with a cut in its benchmark interest rate to 3.25 percent from 3.5 percent after the country posts its worst monthly economic expansion since 2009.

Continue Reading

Wednesday, March 11

Nifty ready for Big move, FII Data Analysis

FII
  • FII's bought 13.5 K contract of Index Future worth 337 cores, 7.5 K Long contract were added by FII's and 5.9 K  short contracts  were squared off  by FII's. Net Open Interest increased  by 1.6 K contract.
Nifty formed  an inside bar pattern and continued with consolidation, Nifty made high of 8755, classical technical analysis at work with Budget day support becoming resistance now.  On Hourly charts trendline support @ 8684/8690 range as shown in below chart and below that 8645/8630 range. As per gann box till 2X1 line is not crossed nifty will remaining under selling pressure. Largest correction seen in the current bull market is 666..

Continue Reading

IRB,IOC and ONGC technical analysis

ONGC

ONGC
Any close above 322 stock is heading back to 330/337/343.
Intraday Traders can use the below mentioned levels

Buy above 315 Tgt..


Continue Reading

Tuesday, March 10

Nifty declines 4 days in row, Trading Strategy for 11 Feb

FII
  • FII's sold 34.1 K contract of Index Future worth 809 cores, 20.2 K Long contract were squared off by FII's and 13.8 K  short contracts  were added by FII's. Net Open Interest decreased  by 6.4 K contract.
Nifty continued with its decline correcting 442 points in 4 trading session  and in the process broke its budget day low @8750 and closed well below its 20 SMA. On Hourly charts trendline support @ 8701/8720 range as shown in below chart and below that 8645/8630 range. As per gann box till 2X1 line..

Continue Reading
Winning Traders Versus Losing Traders

Winning traders take responsibility for all their trades win or lose.
Losing traders play the victim of algos, the RBI, and blame the markets for their losses.


Winners have a trading plan
Losing Traders have emotions, ego, and blame.


Winners find a way to be profitable.

Continue Reading
Case Study on Apple Stock : How Buy Rumor Sell News Work in Stock Market

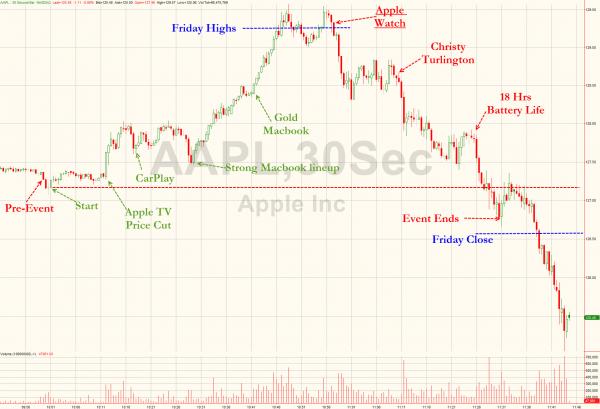
Yesterday Apple gathered the press to give the world  I Watch, this event when Correlated with Apple Stock can be used for case study and planning trade in similar situation around the world.

Apple

Continue Reading

Monday, March 9

Why Sensex Crashed 600 Points, Biggest Fall in 2 months

Sensex corrected by 550 points Nifty almost 200 Points making today as Black Monday,biggest decline in 2 months. Last big decline was seen on 06 Jan 2015. Budget was good market rallying and out of no where we saw a correction. I am discussing few points below which would had led to the correction.

Concerns over Fed rate hike

Equity Market likes liquidity, Friday Strong US jobs data and Unemployment rate coming sub 6%  fueled expectations that the US Federal Reserve may raise interest rates sooner than previously thought.
Hike Rate means sucking liquidity out of system and this will flight to safe assets in Bonds and stronger currency like USD and money getting sucked out of Emerging market. India Markets have received $11Billion in 2015 till date and up 8% till date so profit booking can be done by FII's.
 

Expensive valuations of Stock Market


Continue Reading

Darvas Box Analysis:ACC,LT and HCL Tech

ACC

ACC

Any close below 1686 stock is heading to 1652/1631.
Intraday Traders can use the below mentioned levels

Buy above 1701 Tgt..


Continue Reading

Sunday, March 8

Bank Nifty Weekly Analysis for Week 09-13 March

Last week we gave the Chopad level of 19986 Bank Nifty achieved 3 target on upside and 2 target on downside, We have inflation and CPI  data coming on 12 March which will be closely watched by market.Lets analyze how to trade next week.

 Bank Nifty Hourly

Bank Nifty Hourly
Bank Nifty took support at the trendline @18400 and bounced back strongly closing above 21/34 HEMA. Now 19400 should be closely watched on downside and 19850 on upside. brakout/breakdown below or above this range.

Bank Nifty Hourly  EW Daily

Bank Nifty Hourly EW
Hourly Elliot wave analysis is shown..

Continue Reading