Tuesday, September 30

FII FnO Data Analysis for 01 Oct

FII_1
  • FII's bought 5.7 K contract of Index Future worth 232 cores, 8.5 K Long contract were added  and 2.7 K short contracts  were added by FII's. Net Open Interest increased  by 11.2  K contract , so FII added both long and short in index futures.
Nifty has as expected volatile day , but as per Gann Box it continued trading in Yellow and Green line suggesting range bound volatile move. 7921/7911 have become an important demand zone  and on upside 8030/8060 range have become the supply zone, closing above or below this range can quickly give a move on 100+ point.  We have 3 trading holidays so try to avoid ...

Continue Reading

AB Nuvo, IDFC and Union Bank trading plan

A B Nuvo

Ab Nuvo
Holding 1631 stock can bounce back to 1686/1741.

Buy above 1645 Tgt


Continue Reading

How to trade Nifty in RBI event

FII_1
  • FII's bought 2.4 K contract of Index Future worth 99 cores, 6.3 K Long contract were squared off and 8.7 K short contracts  were squared off by FII's. Net Open Interest decreased  by 15  K contract , so FII squared off both longs  and shorts in Index futures also shorts were added almost  in 1:1.8 ratio.
Nifty consolidated today after 3 of big range moves,formed an inside day pattern signalling market is ready for big move tomorrow after RBI policy is announced ,We have Monthly closing tomorrow bulls would like to see a close above 8000. 8088/7909 are 2 numbers should be watched tomorrow.  EW analysis is shown below.Nifty Future premium  came down before

Continue Reading

Sunday, September 28

Nifty Weekly Outlook for 29 Sep - 01 Oct

Last week we gave  Nifty Chopad level of 8100 and Nifty did 3 target on downside rewarding trend followers by 179 points, Coming week has only 3 trading days so trading will be limited, S&P upgrade was a big positive for India and Our PM meeting Obama will be keenly watched by market so market will trend to be volatile in next 3 trading session, If your capital is small better avoid trading for next 3 trading session.

 Nifty Hourly Chart

nifty hourly
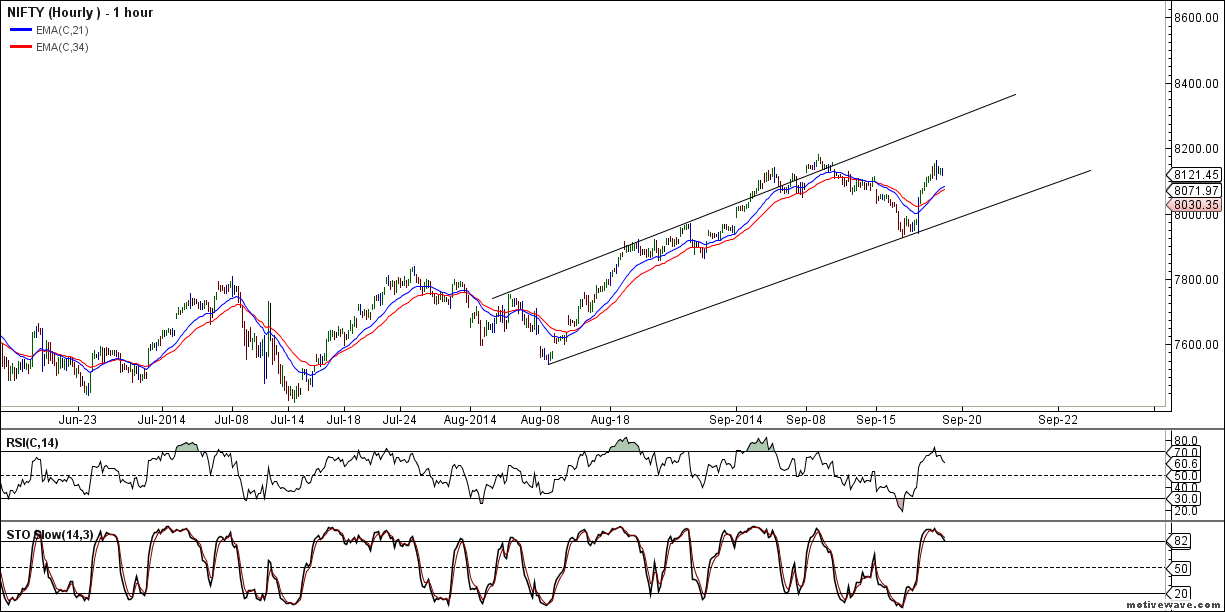
Nifty Hourly charts made a V shaped recovery from channel bottom now facing resistance in zone of 7990-8020 range which is 21/34 ema confluene, Closing above it only can see an upmove till new highs.Move will be volatile in small trading range.

Nifty Hourly Elliot Wave Chart

Nifty Hourly EW
Hourly EW is showing correction is over and rise can be seen till 8110 odd levels.


Nifty Price Channel

NIfty Price Channel


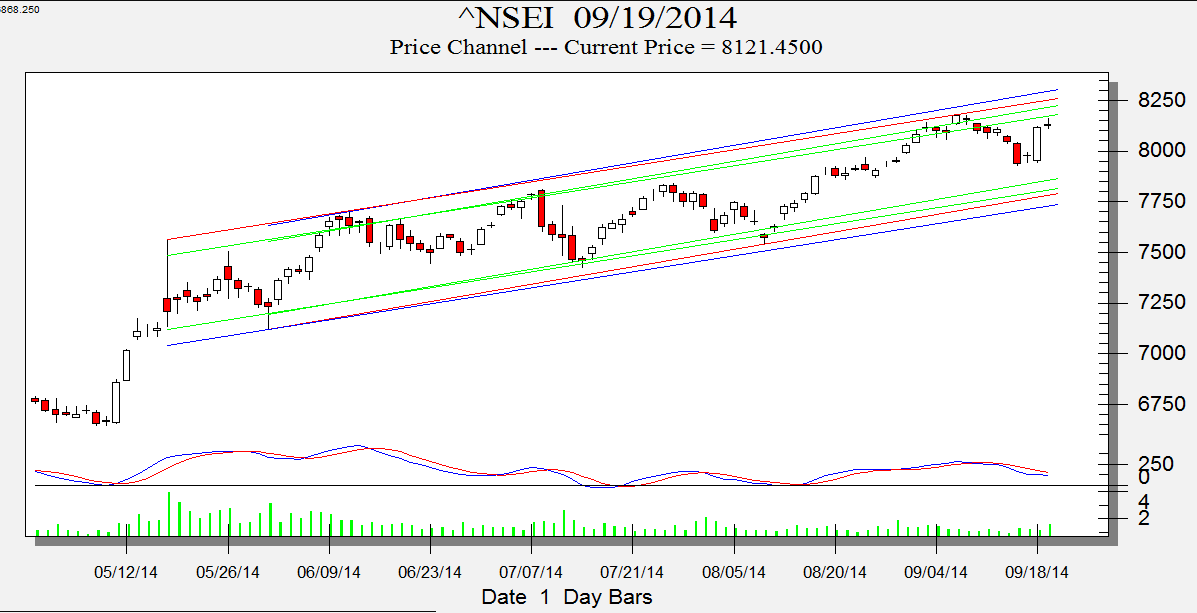
As per Price Channel concept Nifty is entering in zone of

Continue Reading

Saturday, September 27

The Human Psychology behind Day Trading

Market has been Topsy turfy in past 4 trading session and we have a long trading weekend coming ahead which should be used by traders in productive manner to improve trading, Let me discuss a real life incident of my student how he was afraid of trading and how after going through the training he transformed himself in a profitable trader.The same story repeats with many traders and hope the example described below can help you in improving your trading.
Band new Trading day has started and Rahul was ready to trade, As market opened Rahul can see his trade set up giving a Buy Signal but Hesitation gripped Rahul’s tensed hand. He couldn’t decide when to enter this trade. His trading plan said he had really gone past the entry point he should have taken. But he had hesitated – what if he was wrong? He decided to wait and track it just a little longer – just to be safe. This was the story of his trading life – waiting on the sideline frozen by his fear of uncertainty. “If I stay on the sideline, I’ll be safe,” he consoled himself. He watched the price go higher and higher. Still he hesitated.
But as he hesitated on the sideline pondering this trade, Rahul also began to fear he was missing out on a profitable trade – he wanted in. He felt the urgency build. “Just a little more proof”, his tentative side whispered in his ear. “Get in this trade before it’s too late!” urged another impulse, “Sitting on the sideline isn’t getting you...
Continue Reading

Thursday, September 25

Nifty forms panic low, How to trade Expiry day

FII_1
  • FII's sold 4.1 K contract of Index Future worth 164 cores, 5.1 K Long contract were added and 9.2 K short contracts  were added by FII's. Net Open Interest increased  by14.4  K contract , so FII added longs in Index futures also shorts were added almost  in 1:1.8 ratio.
This is what we discussed yesterday  we are nearing trendline support, we can see intraday break of trendline till 7963/7930 but might close above this.  So we did a panic low of 7950 on coal block case and bounced back sharply to close above 8000. As per EW we can now move to 8072 odd levels. Nifty held on to its trendline and today we can see  a follow upmove. Nifty is trading in sideways mode of 7950-8160 and this rangebound trading can go on till bias change from neutral to bullish as discussed in weekly analysis.  Bias is new concept we are developing to understand the future ...
Continue Reading

Wednesday, September 24

Coal India,M&M and PFC harmonic pattern analysis

Coal India

Coal India
Drive Wealth

Buy above 338 Tgt..


Continue Reading

Tuesday, September 23

Nifty near trendline support, Will it hold tommrow ?

FII_1
  • FII's sold 7.9 K contract of Index Future worth 315 cores, 17.5 K Long contract were added and 25.4 K short contracts  were added by FII's. Net Open Interest increased  by 42.9  K contract , so FII added longs in Index futures also shorts were added almost  in 1:1.5 ratio.
This is what we discussed yesterday Bounce seen today was because of Rollover pressure, Nifty again got resisted near the Price Channel as shown in below chart also formed a double top in daily chart, which need confirmation in next 2 days with price not going above 8160 and breaking 8064.Break below 8064 can see a quick down move towards 8015. Gann Turn date today so be cautious in trading expect volatile moves today. Move was totally scripted as we..
Continue Reading

Sunday, September 21

Nifty Weekly Analysis for September 2014 Expiry

Last week we gave  Nifty Chopad level of 8114 and Nifty did 3 target on downside and almost did 1 target on upside. Lets analyze how to trade in September Expiry Week.

 Nifty Hourly Chart

nifty hourly
Nifty Hourly charts made a V shaped recovery from channel bottom now facing resistance in zone of 8130-8150, Closing above it only can see an upmove till 8250 odd levels.

Nifty Hourly Elliot Wave Chart

Nifty Hourly EW
Hourly EW is showing if 8160 is not crossed correction tilll 8015.


Nifty Price Channel

NIfty Price Channel


As per Price Channel concept Nifty is entering in zone ...
Continue Reading

Saturday, September 20

Do's and Dont's in Stock Market

Investing in stock market can be a profitable and enjoyable proposition. It requires a great deal of patience and discipline.
Right attitude and having proper tools is a must in the financial markets. Most traders loose because they do not do their homework and they dont plan their trades.
They also dont realize that they are playing against the best brains in the business. One win alone force them to shed their skepticism and next trade comes out of a jubilant but ignorant and biased mind. To understand the result, one need not to study rocket science.
Most dont understand the value of having proper tools of the trade. Some play on inside information some play on fundamentals and few play on technical. Total percentage of all these together is not more than 15%. Rest play on their whims and fancy.
Thats why only 5 to 7% make money trading. I often ask traders if they have studied any book on trading or traders psychology or any other relevant subject? Shockingly 95% says no and most are not willing to buy and read.
To control greed and fears one must understand the traders or gamblers psychology. Books give you wisdom and one can become a better trader or investor by applying knowledge.
YOU DONT KNOW WHAT YOU ...
Continue Reading

Friday, September 19

Daravas Box Stock Trading:AB Nuvo,Hind Petro and Godrej CP

AB Nuvo

Ab Nuvo
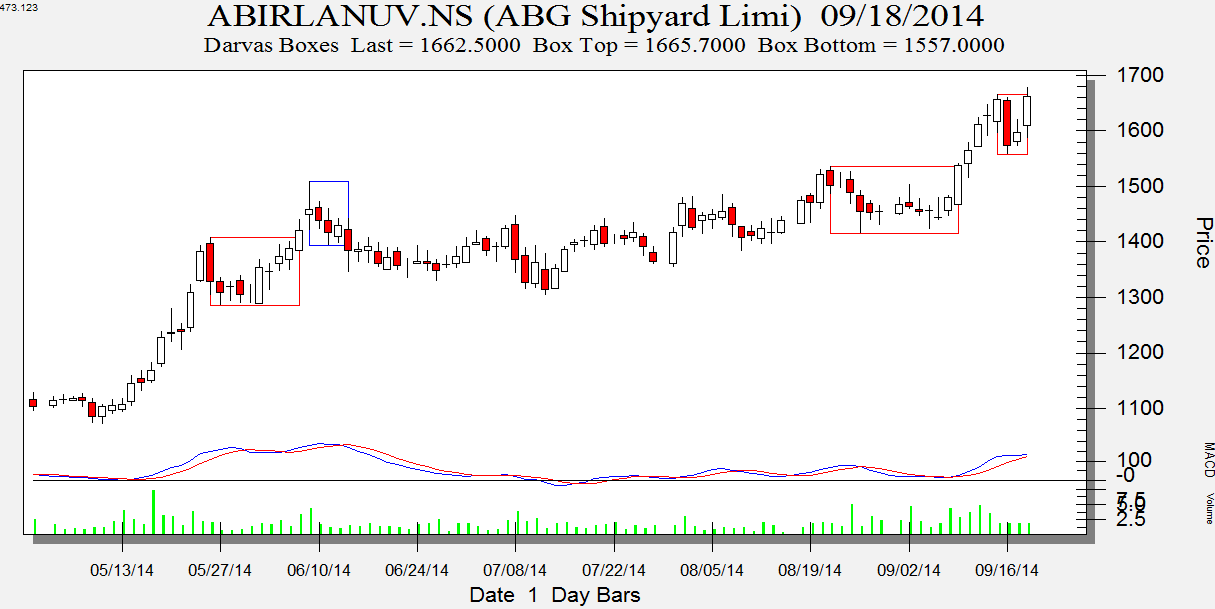
Close above 1686 stock is heading to 1741.

Buy above 1665 Tgt..


Continue Reading

Bulls back with Bang, FII FnO Data Analysis

FII_1
  • FII's bought 15.8 K contract of Index Future worth 644 cores, 22.2 K Long contract were added and 6.3 K short contracts  were added by FII's. Net Open Interest increased  by28.5 K contract , so FII added longs in Index futures also shorts were added but in 1:3 ratio.
As discussed in previous post Nifty Ready for Bounce  we discussed Nifty is near its trendline support and also has corrected just 38.2% retracement of the rise from 7540 odd levels. Bullish patten is totally intact and Bulls were back with bang today, so 4 days of fall was covered in single session clearly suggesting who is at drivers seat.  Now Nifty is nearing an important level of ..

Continue Reading

Tuesday, September 16

HCL Tech,Century Textile and Bata India Technical Analysis

HCL Tech

HCL Tech
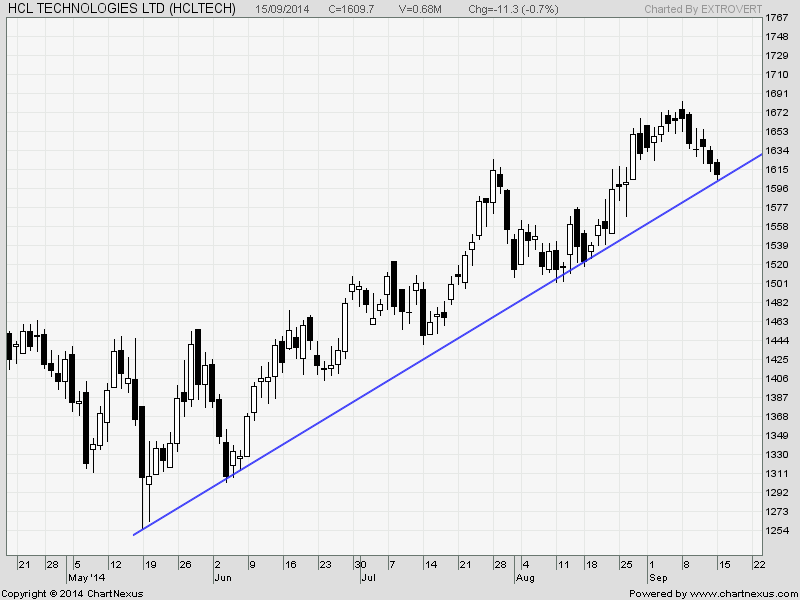
1597 should be watched for HCL Tech by positional traders, Holding the same bounceback can be seen till 1631/1652 odd levels.
Intraday Traders can use the below levels

Buy above 1614 Tgt...


Continue Reading

Monday, September 15

Dravas Box Trading:Apollo Tyre,Crompton Greaves and BPCL

Apollo Tyre

Apollo
Closing below 206 short term target comes @ 199 and 193.

Buy above 209.1 Tgt..


Continue Reading

Sunday, September 14

Nifty Weekly Forecast for 15-19 September

Last week we gave  Nifty Chopad level of 8107 and Nifty did 1 target on downside in choppy week of trading  as weekly range was just 123 points, Lets analyze how to trade in coming week.

 Nifty Hourly Chart

nifty hourly
Nifty Hourly charts trading in channel and also seeing an convergence of 21/34 ema suggesting a range expansion will happen in coming week. Holding 8050 bounce back can be seen till 8200/8240,Break of 8050 will see a pullback till 7950.

Nifty Hourly Elliot Wave Chart

Nifty Hourly EW
Hourly EW is showing if 8128 is not crossed correction tilll 7984.


Nifty Daily Chart

Nifty Daily Bias
Nifty daily chart bias has turned from bullish to neutral..
Continue Reading

Saturday, September 13

How to Build Good Trading Habits in Three Simple Steps

You should keep a trading journal of every trade you make! Backtest every system for at least 1,000 trades! Brush your teeth before bed!
All of this is sound advice. However, how many traders actuallyfollow this advice? Do you? I would bet that less then a third of you reading this article keep a trading journal. Don’t get me wrong, I’m not special. I didn’t keep a record of my trades during the first few years of my trading career. This changed one year ago. Here are the tips that helped me to finally create this habit. These rules are not specific to trading and can be used to build any habit in any area of your life!
The 1 Minute Rule

How do we get on the path of building a habit? This is where the 1 minute rule comes in! If your goal is to keep a trading journal, at
the end of every trading day, take one minute and write down your trades. Even simpler, at the close of trading just write down 1 sentence. This could be your best or worst trade of the day, your trading mood, or a combination of both. Here’s an example:
‘’May22nd: I took a signal where there wasn’t any and I proceeded to lose 4000 as the Nifty  moved against my position’’

Based on a true story. Okay it IS a true story. But as I started to write this down in my journal, I found myself needing to explain why the trade was a mistake. And I wrote more then one sentence, a lot more.

Continue Reading

Friday, September 12

Bitter Truth about Trading

As a Trader it totally amazes me to see how we are almost "hard-wired" to do all the wrong things. It’s almost as if we were put on this planet to determine how many ways we can mess up our trading.How do you respond to a loss? How you respond to losing trade.
During my trading session I ask my students to sit down and write  on, "Why I lose money in trading, Why I fail as a trader " Be honest with yourself. What are your typical excuses?
You might write something like this:
“I was desperate. I was running out of money, and I needed to do something. I really didn’t want to go back to work, so I had to make money. As a result, I really didn’t have time to do a trading plan Instead, I just made trades.”
For the 30 minutes that it takes to do "Why I lose money in trading, Why I fail as a trader ” exercise, give yourself a break and be brutally honest. You know that you’ll con yourself in order to not make any progress. Treat this exercise as a test to determine just how you con yourself. Can you be honest and tell it like it is, o..
Continue Reading

Thursday, September 11

Nifty Elliot wave Analysis

FII_1
  • FII's bought 773  contract of Index Future worth 32 cores, 6.1 K Long contract were squared off and 6.9 K short contracts  were squared off by FII's. Net Open Interest decreased  by 13 K contract , so FII squared off both  long and shorts in Index futures.
Nifty opened with gap up , touch the upper band of Hourly channel and fall down to touch the lower end of trading range, As disucssed yesterday analysis  8050-8060 needs to be watched closely in coming 2 session, Nifty made low of 8057 and bounced back. On Upsidse move above 8135 can see Nifty moving back to 8160-8170 odd levels.As per EW analysis Nifty can

Continue Reading

Tuesday, September 9

FII FnO data Analysis for 10 Sep


FII_1
  • FII's sold 6.5 K  contract of Index Future worth 267 cores, 11.1 K Long contract were squared off and 2.8 K short contracts  were squared off by FII's. Net Open Interest decreased  by 15.6 K contract , so FII squared off both long and shorts in Index futures.
Nifty continued trading in hourly channel and on daily chart near the rising trendline. Negative divergence are visible but close below 8100 is required for the divergence to show effect. Expect a good trending move in next 2 days as per time cycle analysis. 8200-8250 range should be used by traders to lighten up longs looking at euphoria..
Continue Reading

Sunday, September 7

Nifty Weekly Chopad levels for 08-13 Sep

 Nifty Hourly Chart

nifty hourly
Nifty Hourly charts trading in channel and near channle bottom, Holding 8050-8030 range nifty can scale back to new high, else correction till 7950 on cards.

Nifty Daily Chart

nifty daily
Nifty daily chart is near its upper trendline and also Bulls indicator is making negative divergence

Continue Reading

Nifty way forward for 2014 based on 2009 Election move

Using the Similarity in Price Action of  Year 2009 we are trying to analyze the way forward for Nifty in remaining of 2014

Bulls have been riding the Dalal street from Feb Month and got in momentum after May 16 election results. Analyst on Streets have been talking about 8500/9000 odd levels and every dip coming in market is getting bought into.
I tried to analyze the chart of Nifty from 2009 after election results and interesting study came out.
After 2009 election as seen in below chart Nifty saw 2 UC's followed by a period of upward sloping  from consolidation between two trendlines and then the upside breakout. The post pattern above the breakout resulted in move towards 123.6% of the channel width which formed an important top @ 6336 and than 1000 point correction in Nifty.
Post 2009
Continue Reading